TS TradePlan is a precise support and resistance based trading plan, available for ES, YM, NQ, 6E, CL, and GC futures markets. Trade Plans are produced daily. Get started with a 2-week trial today.
TradesViz is an advanced online trading journal. Auto-sync with NinjaTrader and Tradovate. It includes auto-plotted executions on charts and more than 300 statistics, including MFE, MAE, best-exit analysis and more! Auto-sync with brokers and discover your trading edge!
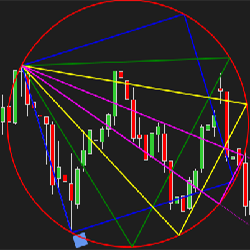
We are pleased to bring NinjaTrader users this tool typically reserved for expensive institutional platforms. The Gann Emblem is a drawing tool for those familiar with its applications, especially traders of the Gartley method.
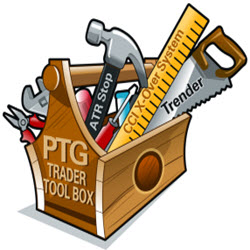
The PTG Trader Tool Box v1.0 Software Suite includes the full package of ALL 27 Polaris Trading Group Indicators. Discover a wide variety of ways to look at the markets to accommodate and enhance your trading plan.
Actual Trading are professional traders and experts in market analysis, providing personalized training adapted to the needs of the customer. NinjaScript programming and development on demand. Exclusive indicators and systems for retail, professional, or institutional trading, and much more.
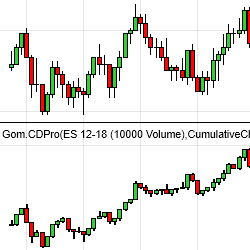
GomCD for NinjaTrader 8 displays the Delta information of the chosen instrument. It shows cumulative or non-cumulative charts, for easy delta analysis and delta divergence identification. It can also be used in custom NinjaTrader strategies and the Market Analyzer.
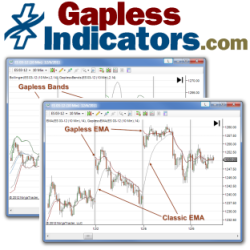
Never worry how an opening price jump or drop affects your favorite classic indicator (MACD, Stochastics, EMA, ATR, etc.). Gapless Indicators are enhanced versions of 15 classic technical indicators that self-adjust in real-time to any opening gap (aka overnight gap).
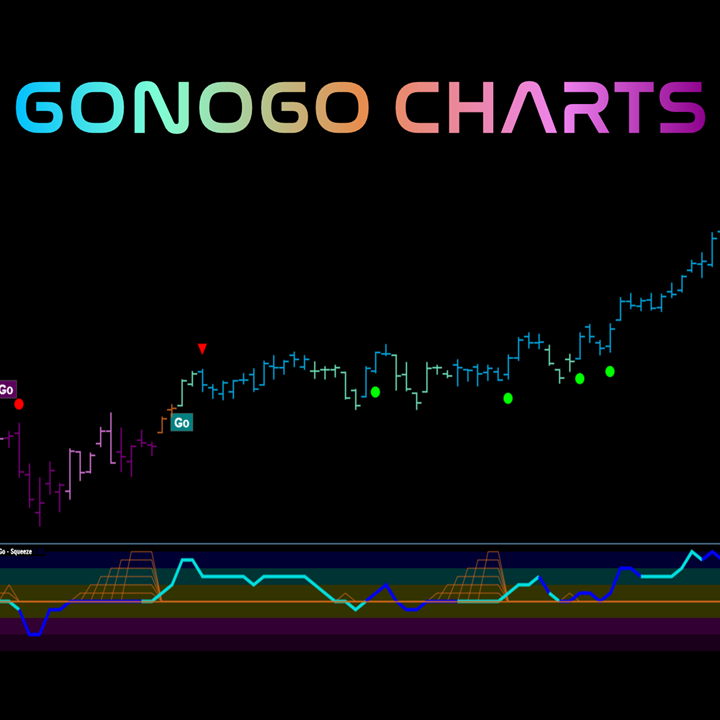
GoNoGo Charts® incorporates multiple widely tested and commonly used technical indicators into proprietary trend and momentum models for a complete technical perspective without cluttering your charts. GoNoGo Trend® is a model that includes tools like multiple period moving averages and more.
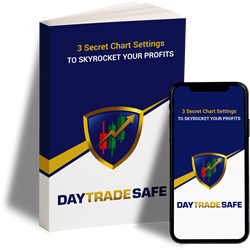
Grab this FREE 10-page guide today! Discover little-known chart settings that will have a huge impact on your trading consistency.
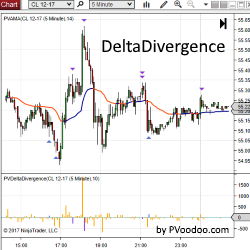
PVDeltaDivergence Indicator is a powerful tool designed to help traders identify possible turning points in their favorite markets with order flow analysis. Get a free trial of PVDeltaDivergence for NinjaTrader today!
December 2, 2024
Mastering Sideways Markets With Auction Bars and Range Projections
November 19, 2024
Enhancing Your Automated Trading System: Key Insights from Best Pro Trade
November 14, 2024
NinjaTrader New Ecosystem Tools: October 2024 Edition
Enter Email for Updates