The Linear Regression Channel (LRC) is designed to truly detect when prices are overbought or oversold. Different than other LRC indicators, the width of the Stealth Traders LRC channel is based on a proprietary formula, designed to pinpoint opportune entry and exit signals. Upgrade Your LRC Today!
Semi-auto trading tool used to help enter and manage trades when using Renko style charts. Customize entry condition, stops, targets, breakeven and trail.
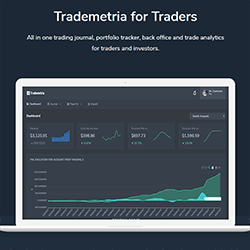
This all-in-one trading journal, portfolio tracker and trade analyzer software helps traders and investors make better trading decisions based on statistical evidence. Better trading starts with better data.
Get precious info to start your trading week! Focused 100% in E-mini S&P500 Futures and based in a mix of technical analysis with order flow tools, the newsletter presents possible trading scenarios for the week, highlighting important regions. Sign up now for FREE!
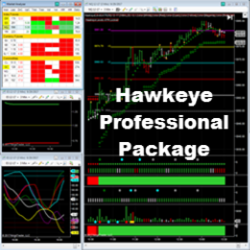
The Hawkeye Professional Package includes all Hawkeye tools for volume spread analysis, on multiple time-frames across all markets. These powerful indicators tell traders when a trend is commencing, in congestion and where to find the correct exit. Buy Now using code: “NT10Off” for a 10% discount.
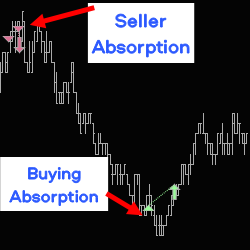
Absorptions are announced in real time with audible alerts and/or drawings on the chart. It also analyses backticking following absorptions. Adapt your trading zone live, with a toolbar on the chart. Strategy builder compatible.
The EminiScalp Stalker is an automated strategy that is designed to assist traders with the ever-difficult emotion of entering and staying with a trade. The Stalker searches for potential scalping and trend entries throughout the trading session.
Our advanced automated trading system is specifically designed for futures scalping. By analyzing price action, volume and Fibonacci levels, our system takes the emotion out of trading and executes precise trades with lightning-fast speed. Get an edge in the markets and let our system work for you.
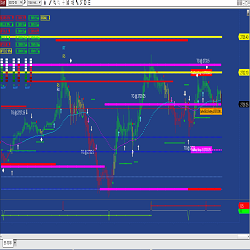
Our automated trading system features scalping, swing trading, automatic entry & exit signals and price action-based trading. With no optimization required, the Best Pro trade systems are based on statistical analysis and algorithms based on advanced mathematical computations.
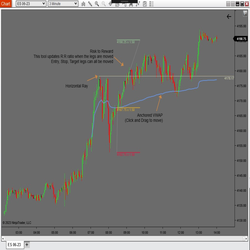
PureAlgo has developed a set of drawing tools to assist you with trading, including Anchored VWAP, Risk Reward PA and Horizontal Line. The package includes all of the tools and is priced at $10.
December 2, 2024
Mastering Sideways Markets With Auction Bars and Range Projections
November 19, 2024
Enhancing Your Automated Trading System: Key Insights from Best Pro Trade
November 14, 2024
NinjaTrader New Ecosystem Tools: October 2024 Edition
Enter Email for Updates