A complete course designed to teach you how to install NinjaTrader 8, how to install our templates and custom indicators, and how to day trade S&P Futures. Our method is similar to swing trading and scalping combined - but trades are only for the current day. Three-day money-back guarantee.
High rated Quant Developer/Trader specializing in NinjaTrader. They have worked with high profile clients/organizations and have professional experience working at an Algo trading desk. They focus on providing value to all their clients and earning their trust.
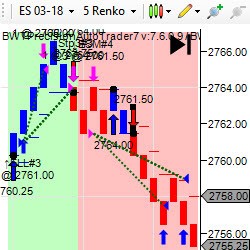
The BWT Precision Autotrader is a state of the art trading tool/software that automates most of the tasks of manual trading, like trail stops, daily goals, entries and profit targets. It uses a universal directional algorithm that brings accuracy, discipline, risk & money management to your trading.
The Pyramid Bundle is a great value and contains our entire collection of current and future indicators. As an owner, you'll never pay more for premium support, upgrades or new product releases. Receive instant access to our entire collection of indicators with a free 14-day trial!
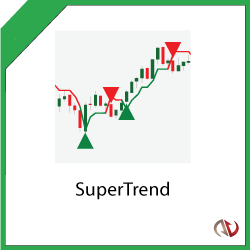
Our SuperTrend Indicator will catch the trend and improve trading consistency with smart trend-following trading signals. SuperTrend highlights trend direction, continuation and reversals while filtering out false signals. Buy & sell signals are printed onto the chart when trend direction changes.
Thapelo FX Knight Trading Academy is a trading training academy, helping amateur to middle traders gain their consistency in the trading industry.
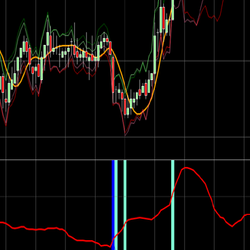
This indicator is extremely versatile and can be used in several time frame charts and even bar charts including range, tick or volume. It works best for instruments like NQ, ES or YM over tick charts. See the real price movement and identify the spikes in the curve plot.
The OM Indicator gives buy and sell signals at the potential markup/down level of the price. Trade confidently with multiple-timeframe analysis. It can also be used for scalping. Never miss your entries with audio alerts. Get your free trial today and bring precision to your trading!
ApexAlgo is a cutting-edge AI trading indicators powered by ApexA.I. It delivers precise market signals for informed trading decisions. The latest update introduces confirmed signals, enhancing your trading strategy like never before.
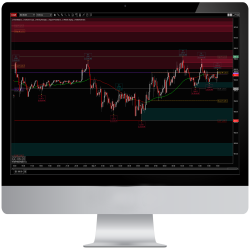
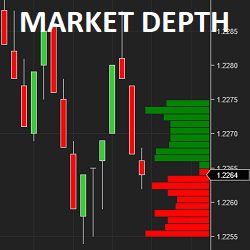
itcMarketDepth is an indicator used to read depth of market data. Reading the depth is useful to qualify key support & resistance levels. This helps traders to know if a level will hold or break. itcMarketDepth can be customized by color, size of bars, filter, number of elements to display & more.
December 2, 2024
Mastering Sideways Markets With Auction Bars and Range Projections
November 19, 2024
Enhancing Your Automated Trading System: Key Insights from Best Pro Trade
November 14, 2024
NinjaTrader New Ecosystem Tools: October 2024 Edition
Enter Email for Updates