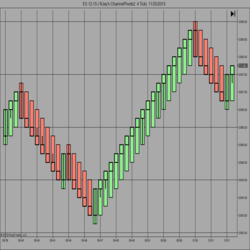
Pick from 8 different bar charts, offering features found nowhere else. Customized renko, range, tick, and time-based charts are available. Most charts have unique chart styles included (classic candle, price action, and xray). Get a free trial now!
Custom design. Custom actions. Create buttons that interact with standard NinjaTrader ATM strategy orders. Fully customizable, including button and font color and size as well as button width and position. Actions can be based on a wide variety of reference prices and offsets.
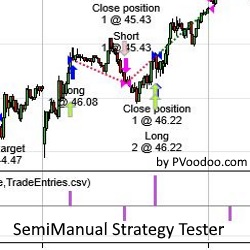
Do you have an idea which you would like to test without actually writing the strategy code to get the trading results? A simple way to do that is by using the PVAddManualTrades and PVUseManualTrades strategies, both utilizing statistics and options from the Strategy Analyzer. Try them free!
Do you have a trading concept? Let's get it coded right now! Schedule a free consultation today with Yuri, algorithmic trader and full stack developer. NinjaCoding provides solutions for strategies, indicators & extensions to visualizers, database server integrations and third party conversion.
Try our fully-functional, ready-to-use automated trading strategy for NinjaTrader 8 at no cost for 14 days. Designed for the futures market, it has been thoroughly backtested, needs no adjustments, & is suitable for Micro/Mini markets. Full support and templates are included during your free trial.
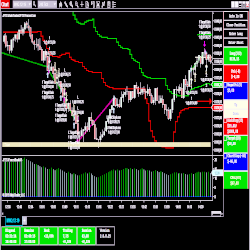
JTFS AutoTrader is designed for both discretionary & fully automated trading with a highly-customizable & easy-to-use interface. This strategy includes risk control, entry signals, manageable trailing stop & gain, target by ticks, sound alarms and more.
Patented! 'UFOs' stands for UnFilled Orders. Intelligent technology saves time and adds precision when planning entries and exits. Identify buy and sell UnFilled Orders in all markets and timeframes. Answers the question, “What is potentially an intelligent buying price or selling price?”
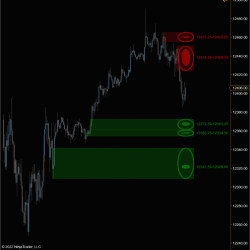
Identify market inefficiencies by marking fair value gaps (FVGs) on the chart that meet predefined size criteria. The indicator distinguishes between bullish and bearish gaps and changes their color once they are inversed. It provides clear visual cues for potential rejection trades from these gaps.
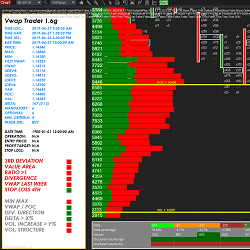
itcVwapTrader is a strategy for NinjaTrader 8 which is based on the mean reversion and the use of orderflow (vwap, footprint, market profile) for precise entries. This strategy uses more than 14 criteria for decision making. The strategy is highly customizable and comes in 3 versions.
This course is aimed at all who wish to understand the American financial market and participate in it, either by actively trading or long-term investing. We cover topics such as opening an account abroad, IR, news and advanced techniques to operate assets such as S&P500 and Petroleum.
December 2, 2024
Mastering Sideways Markets With Auction Bars and Range Projections
November 19, 2024
Enhancing Your Automated Trading System: Key Insights from Best Pro Trade
November 14, 2024
NinjaTrader New Ecosystem Tools: October 2024 Edition
Enter Email for Updates