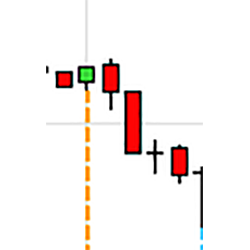
Several studies have found a connection between full and new moons and stock market performance. Knowing how and when to time the cycles in trend shifts is centuries old, but new to most traders.
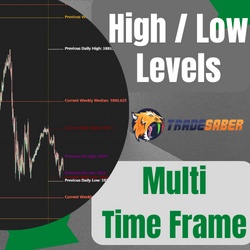
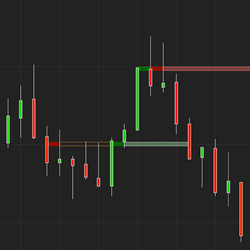
This indicator marks the High/Low median of the previous candle in various time frames. Options include: 1 min, 5 min, 15 min, 30 min, 60 min, 240 min, previous daily, current daily. previous weekly and current weekly.
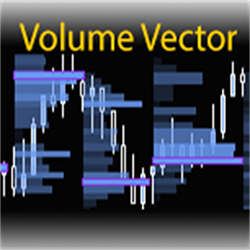
The Volume Vector tool creates automatic volume profiling of price action swings. Increase trading consistency and see exactly where trades have been initiated!
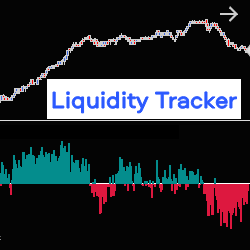
The Liquidity Tracker allows you to monitor, in real time, liquidity variations in the Order Book (pending orders at Bid & Ask), on one or two correlated instruments, at the same time. It therefore allows you to follow the evolution of the market based on the strength of supply or demand.
See when & where aggressive traders act and track these levels over time with EDGE Zones. emoji trading's order flow analytics track real-time supply & demand. Is it continuing with potential to hold, or exhausting with potential to break? Get started with a free 7-day trial today!
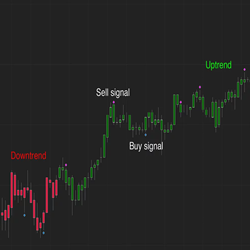
The Q-Indicator provides visual signals of overbought or oversold conditions in the market. Users can enter trades manually or use the indicator in an automated system to take advantage of the various market imbalances.
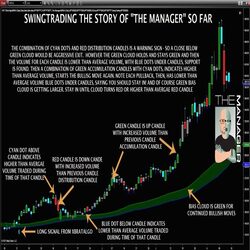
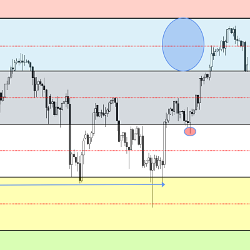
The Manager helps with simple and repeatable trade management. Using a number of tools like average volume, volume distribution or accumulation and an adjustable BIAS cloud, it can help you evaluate whether the market is reversing or just pulling back.
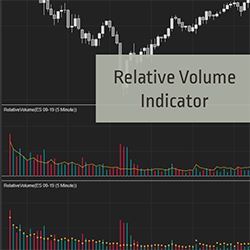
Detect unusual or below average volume easily. Identify the start or end of a move with no effort. Relative Volume (RVOL) compares current volume to the average volume for the same time of day. Start your 2-week trial now!
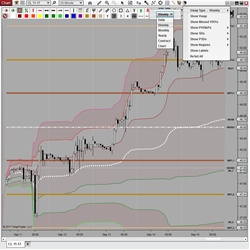
VWAP Plus features 7 configurable Session Types (Daily, Weekly, Monthly, Contract, etc.) and 3 user defined upper and lower standard deviations. It displays 17 Unique Current & Previous Levels, includes a toolbar icon for easy setup, and is Market Analyzer, Strategy Builder & Bloodhound ready!
The E-widget is a suite of tools like a Swiss Army knife, offering customizable analytical solutions for traders. Use E-mini Wizard preset templates for Fibonacci levels, support & resistance, risk:reward ideas, regression trades, or build your own. E-widget is designed to work on all markets.
December 2, 2024
Mastering Sideways Markets With Auction Bars and Range Projections
November 19, 2024
Enhancing Your Automated Trading System: Key Insights from Best Pro Trade
November 14, 2024
NinjaTrader New Ecosystem Tools: October 2024 Edition
Enter Email for Updates