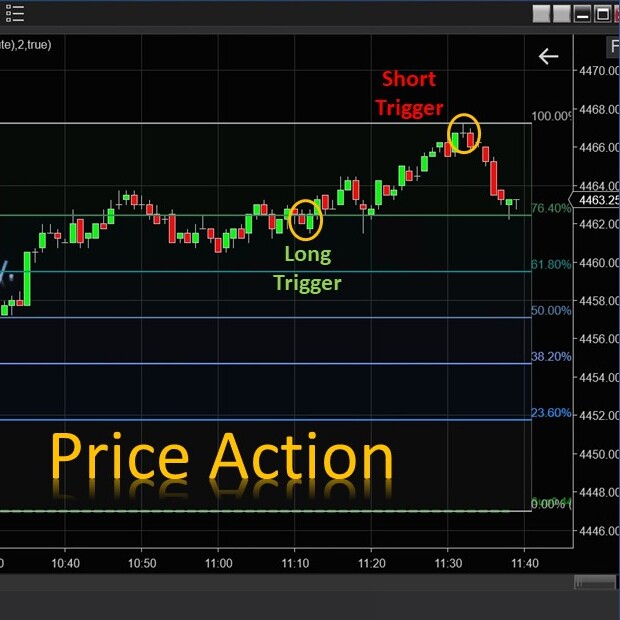
The E.G. Price Action is automatically integrated with the E.G. Trigger Point presented on your chart to generate short and long signals for you. It recognizes Price Action opportunities and generates arrows presented on your chart and sound notifications.
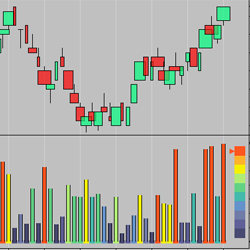
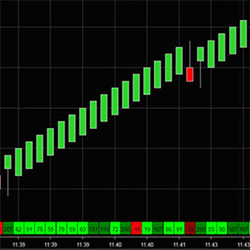
The IT_VolZoom, shown with IT_FatBars (uses same engine), shows volume level relative to the surrounding volume. The histogram is colored according to a 10 step heat meter which is shown on the right (bar colors optional). It accurately shows high volume even in low volume conditions.
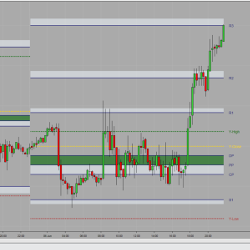
Session Pivots are a well known trading technique to calculate intraday support and resistance points. Because of its simplicity and efficiency, it is still a very reliable method for determining key support and resistance levels.
Our Custom Programming service is ideal for small and short-term projects. We believe programmers should be allies to trading, not a money drain. We only accept payment if you are satisfied with our work. We charge a very reasonable $15 USD per hour rate.
With a potential of 1 trade per day, this system is automated from start to finish & designed to be monitored in some capacity. If you can remotely access a computer with the right software, then you can monitor these automated trades from the golf course (with a strong cell signal).
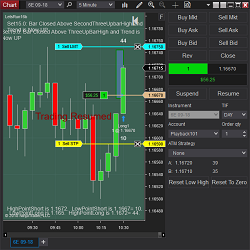
Let’s Run is a breakout strategy used for discretionary or automated trading with a Chart Trader switch. It triggers based on built-in trend finding indicators with customizable settings for stop options and reset buttons. It is fully flexible with both swing and scalp capabilities. Learn more!
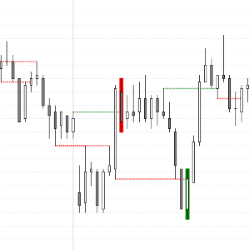
This indicator shows Breakout Tests or Breakout Pullbacks of broken support and resistance in real-time. As a beta feature you can also test Failed Breakouts. Use the Breakout Test indicator as a discretionary indicator in your day trading. Get started with a free 2-week trial today!
Market Delta Volume Profile is designed to distinguish if buyers or sellers are in control & to see breakdown of volume in each bar. It’s used to identify price reversal areas and look into the price action of each Renko bar to view volume profile, price & monitor order flow.
The TrendLord indicator is a chart overlay indicator that can be used as a confirmation indicator. It is a derivative of a smoothed moving average but with the advantage of representing it as a colored change histogram. Click to learn more.
The Job Pivot is a volume profile analysis that allows the user to gauge a directional bias with price targets. It provides an equilibrium between buyers and sellers for the purpose of identifying control of the session’s auction.
December 2, 2024
Mastering Sideways Markets With Auction Bars and Range Projections
November 19, 2024
Enhancing Your Automated Trading System: Key Insights from Best Pro Trade
November 14, 2024
NinjaTrader New Ecosystem Tools: October 2024 Edition
Enter Email for Updates