The Samri Math Diamond Grid is a drawing tool which is applied by drawing a square on a chart. The tool then automatically displays graphic elements which are based on calculations from the methodologies of Gann & Murrey.
Experience first-hand how Touch Zone Trading identifies opportunities & manages trades. Whether you’re trading part-time or full, you’ve got to be ‘in the zone’ to perform. Are you a good fit for the Touch Zone Trade Room? Take the trader survey!
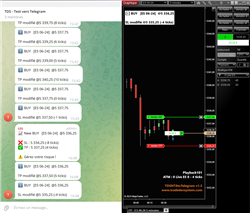
This indicator will be responsible for sending on your telegram channel your positions taken using ATM.
Collect MAE/MFE data where NinjaTrader leaves off. Get the ability to measure your moves after you're out of the trade.
Are you busy but want to be consistent in the market? Do you want a strategy with fixed rules? Here, you get an automatic robot including an indicator and complete strategy, plus access to an internal Discord channel. Get started with a one-week free trial today over zoom, no installation needed!
In the rapidly evolving landscape of the stock market, traditional trading strategies and indicators often fall short in the face of complex and volatile market conditions. This is where Artificial Intelligence (AI) steps in, revolutionizing the way investors approach trading.
The ST Inside Bars visually displays when a time-based bar forms inside a previous bar, also known as a Mother Bar. Learn more about ST Inside Bars today!
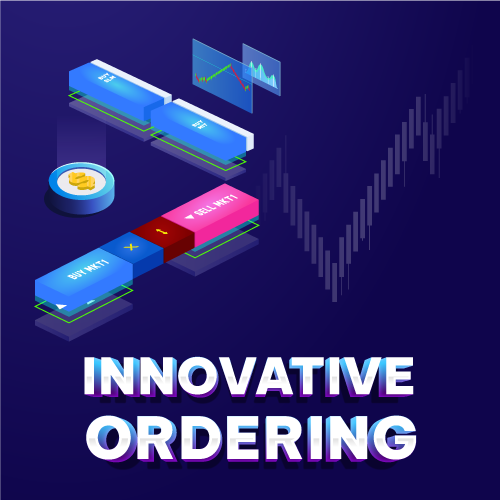
Ideal for those wanting to place pending orders with a single click, execute lightning-fast market orders, or simplify trading for users with slower computers or impaired eyesight. Key features include support for various order types, quantity presets, ATM selector, and real-time status display.
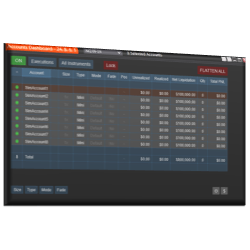
Duplicate Account Actions is the premiere NinjaTrader trade copier solution, built to keep all your positions and orders across all accounts in sync at all times. Finally, eliminate stress and challenges related to issues from other trade copier solutions!
Free trading psychology masterclass. Learn the complete trading psychology system to overcome destructive trading habits and reach pro-level consistency in as little as 8 weeks (even if you are starting with zero willpower and breaking your rules every time you trade). Register today!
December 2, 2024
Mastering Sideways Markets With Auction Bars and Range Projections
November 19, 2024
Enhancing Your Automated Trading System: Key Insights from Best Pro Trade
November 14, 2024
NinjaTrader New Ecosystem Tools: October 2024 Edition
Enter Email for Updates