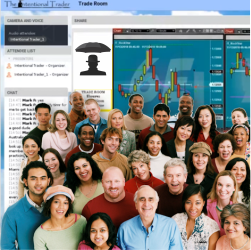
Day trading six futures instruments every day from 9am until 12pm Eastern time. Watch the Intentional Trader system in action in real time. Listen to a trade room moderator call out trades before entering them. They have been trading the same system and indicators since 2009!
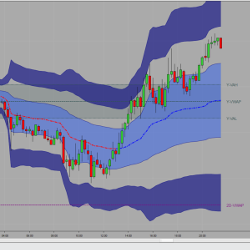
The Volume Weighted Average Price (VWAP) tells traders the average price for all transactions executed during a trading session, such as the current day, week, month or quarter. Many institutional traders execute based on the VWAP, so it is an important price benchmark to control transaction costs.
Experience trading evolution with our automated bot! Powered by a dynamic trailing trend system, it adapts to market shifts for optimal entries and exits. Elevate your strategy now!
This intelligent indicator will help you predict pullbacks and trend reversals. It uses an innovative form of volatility divergence which helps create consistency. In addition to smart signals and performance statistics, the Divergence Cloud also displays a unique glowing cloud on the chart.
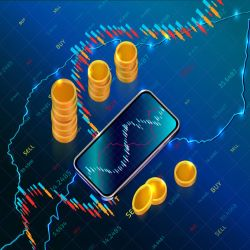
In the rapidly evolving landscape of the stock market, traditional trading strategies and indicators often fall short in the face of complex and volatile market conditions. This is where Artificial Intelligence (AI) steps in, revolutionizing the way investors approach trading.
Innovation in Momentum: SPEARHEAD is a cutting-edge indicator for traders and investors. It compares the momentum of two instruments, with one being a custom synthetic instrument created by the user, incorporating up to seven assets like stocks, commodities, currencies, etc. Also in Spanish.
Forex Trading Unlocked Online Trading Courses provide forex, futures, options, and binary options traders with the tools they need to navigate stormy market environments. Learn for yourself how to recognize trading setups that put you in the driver's seat of your trading destiny.
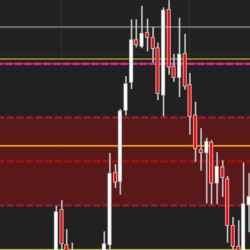
The “opening range” is the range obtained from the highest and lowest price of a security during the first minutes of daily trading activity. The JATS Opening Range Indicator displays the OR and the current open of the RTH session for a defined time period, as well as the pre-session Globex.
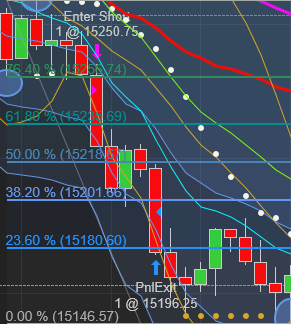
Neural Director advises trade direction and when to enter with the Golden Signal indicator. This toolset includes a predesigned workspace, accurate daily Power Fibs for many futures and forex markets, automatic Fibonacci extensions and automatic ATM entry.
Trading Mentor is an automatic system based on data science which helps traders understand the most important insights of their trading and adjust their trading strategies for consistent results.
December 2, 2024
Mastering Sideways Markets With Auction Bars and Range Projections
November 19, 2024
Enhancing Your Automated Trading System: Key Insights from Best Pro Trade
November 14, 2024
NinjaTrader New Ecosystem Tools: October 2024 Edition
Enter Email for Updates