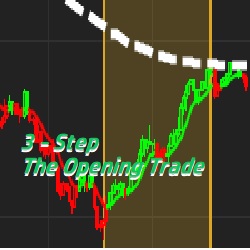
The 3 Step Indicator and Workspace package from The Opening Trade combines three basic elements into a simple Red vs Green color coded, Mean Reversion Discretionary System. Price Action, Trend Strength and Supply and Demand are what drive this 3 Step System.
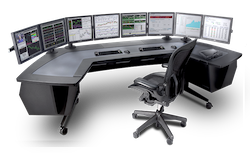
Immerse yourself in a dynamic trading environment with AmerTd's On-Site & Virtual Trading Rooms. Equipped with the latest technology and real-time market data, this state-of-the-art facility offers a collaborative space for traders to execute strategies and maximize their potential.
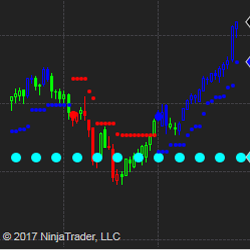
The VWAP Predator uses VWAP as a zonal guide with Bull and Bear Bands. It then uses logic to recognize accumulation and distribution candles. If those candles cross from a zone to another, then a Signal Candle is produced. Buy Signals in the Bullish Bands and Sell Signals only in the Bearish Bands.
SpeedyAlert is a free tool that sends you an email notification if a running application crashed, stalled or is short on RAM & other critical resources. This is a very useful tool for PC’s hosting 24/7 automated strategies. Avoid these not so funny “surprises” & download SpeedyAlert today!
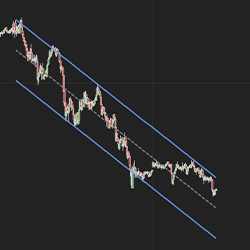
Trend channels are one of the most respected trading strategies used in the markets. However, they can sometimes be tricky to draw, and it's difficult to know if your lines are accurate. Tyche Trading’s unique Price Action Trend Channel Indicator makes it easy! Get a seven-day free trial today!
You can now calculate your recommended trade position size for stocks based on the current market volatility and your risk appetite, in real time. Once you input the “RiskPerTrade” amount, It displays the number of shares in your market analyzer column. Get this powerful risk management tool!
AbleTrend offers a time-tested color-coded trading system featuring dynamic support and resistance indicators that produces buy, sell and exit trade signals. It can be used on any timeframe in the stocks, futures and forex markets. Get started with a 30-day trial for $79 today!
BitBlockBridge for Bybit Traders is a NinjaTrader add-on offering real-time cryptocurrency chart data, supporting both minute and tick charts. Designed for Bybit traders, it integrates seamlessly with NinjaTrader, providing comprehensive asset coverage, a user-friendly interface, and more.
Every download will receive a 14-day Free Trial of the app on either Android or Iphone. You will be able to test the technology, analysis, trading signals and everything else at no cost. See how Forex Trading Unlocked can enhance your forex and futures trading. Gain trading consistency!
Instantly receive clear buy and sell signals in real-time, simplifying trading decisions. Enhance trading strategies by knowing exactly when to enter and exit positions.
December 2, 2024
Mastering Sideways Markets With Auction Bars and Range Projections
November 19, 2024
Enhancing Your Automated Trading System: Key Insights from Best Pro Trade
November 14, 2024
NinjaTrader New Ecosystem Tools: October 2024 Edition
Enter Email for Updates