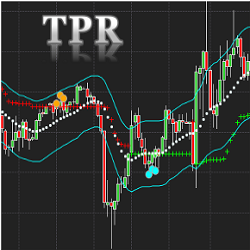
The Trend Pullback Reversal (TPR) Indicator displays possible price trends with pullback and reversal signals. TPR will focus on the main trend and filter out most minor price movements. The NinjaTrader 8 version comes with a unique band and center line as additional features.
Learn how Volume Profile works and use it to track big financial institutions who move and manipulate the markets. Learn my most favorite Volume Profile trading strategies. This book is written in poignant way with many illustrations and real trade examples.
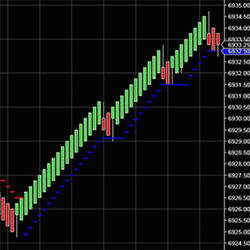
Trailing Stops move with the price action, not a lagging indicator. The indicator was designed for traders to use and to have no hassles of calculating your stop losses. The software does it automatically; never second guess the trend again. Can be used to lock in and protect your profits.
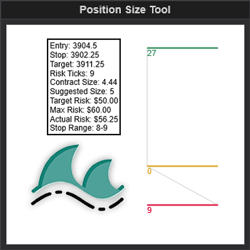
This indicator allows the user to get the position size based on the stop size of the Risk Reward tool. This increases application functionality and user charting efficiency.
The Quantum Trend Monitor gives traders the confidence to follow trends, by incorporating an easy-to-read colored representation of current market trend. Use the Trend Monitor in tandem with other trend following analysis tools to help eliminate emotions from your trading!
Ninja Mobile Trader VPS allows 24/7 access to NinjaTrader 7 and NinjaTrader 8 across all operating systems (Windows, Mac). Log in from anywhere in the world, any time, on any device (iPhone, Android, tablets, home computers). Start trading on Mobile today!
PVIPeaks Indicator and Strategy pinpoints peaks from any standard NinjaTrader indicator and allows traders to use them to generate a signal for an automated strategy. This tool is available exclusively for NinjaTrader 8. Get your free trial today!
The Oil Trading Room is a product of Robbins World Cup Champion Trader Rob Mitchell. It has a unique Scientific approach with Trading Signals, Indicator applications using Market Profile, Price Action, Order Flow, Momentum, Order Flow Momentum, Support Resistance, Market Mapping and more.
Douro Day Trading indicators are specifically designed for five minute chart trading targeting the European open, US premarket, US open and US. They are also designed for 5 minute, 15 minute and 60 minute combination trading, and produce up to 60 valid trades in a 24 hour period.
The Cycle Trend was developed as a way to evaluate trends with as little lag as possible compared to more conventional indicators such as the ADX or MACD. The idea behind this is that the price action and the shapes of the bars relative to each other is more accurate at defining the mood.
December 2, 2024
Mastering Sideways Markets With Auction Bars and Range Projections
November 19, 2024
Enhancing Your Automated Trading System: Key Insights from Best Pro Trade
November 14, 2024
NinjaTrader New Ecosystem Tools: October 2024 Edition
Enter Email for Updates