Includes volume profile and TPO market profile, presets for one-click charting, daily, weekly, monthly, date, composite, and drawn profiles. Offers defined or continuous session types and load optimization. All of these features make it one of the most advanced profiles available on the market.
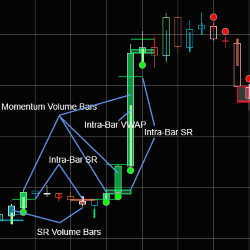
Every bar contains information. You miss a lot of valuable information due to filtering bars by time, variance or some other method. The best solution is to allow these bars to provide you with all the valuable and needed information in a compact and informative manner.
The Key Levels Confluence Indicator calculates various daily levels and combines them into powerful zones where price action is likely to respond in the future. Daily levels include the Open, High, Low and Close (OHLC) of past days, Fibonacci Levels, Whole Numbers, Current Day Levels and Pivots.
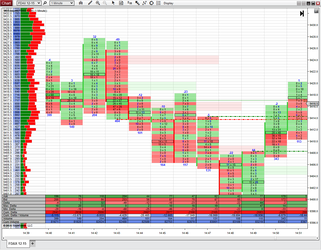
Pure and simple footprint (aka market profile or order flow chart) and volume profile chart add-on for NinjaTrader. Displays bid and ask volume traded at each price at each bar. Alternative charts – range, volume and tick charts - are also fully supported.
The Visualized Trader helps make trade signals easy to see by measuring 5 uncorrelated energies of money flow. When they are all bullish or all bearish at the same time it plots a simple red or green box on your chart, eliminating the need to clutter your chart with a lot of indicators.
Easy Trader is a complete trading system and offers many options. The display is easy to read and use. When a signal fires, an arrow is plotted and can be used with our ATM Entry Assistant. Easy Trader is our oldest product, has been in use over the past twenty years, and it still works.
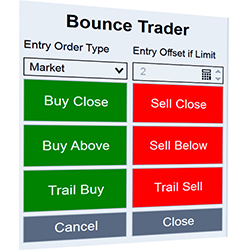
Get fast and accurate fills with Bounce Trader. Trade directly from your charts. Easily trigger orders on bar close, bar reverse or open OCO orders depending on how bar closes. Select between market or limit orders. With Bounce Trader and Simple EMA’s, it is easy to spot where price bounces from.
tickmatrix is a small team of disciplined and dedicated programmers who architect intermarket trading strategies, indicators, API and more.
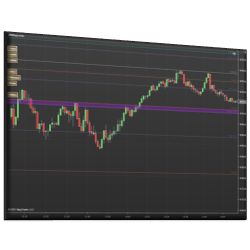
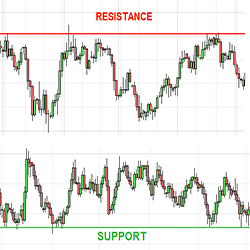
Plots chart and/or synthetic support and resistance lines from a higher time frame.
Get the latest knowledge for independent traders to help them create custom tools, and processes and develop the mind needed for a successful trading career. Learn a unique technical analysis method and build trading strategies with a known edge, using a computer-based statistical approach.
December 2, 2024
Mastering Sideways Markets With Auction Bars and Range Projections
November 19, 2024
Enhancing Your Automated Trading System: Key Insights from Best Pro Trade
November 14, 2024
NinjaTrader New Ecosystem Tools: October 2024 Edition
Enter Email for Updates