The Exhaustion Absorption Detector, which is based on live time and sales data, is designed to display order activity between the bid and offers at market price.
GomBang displays double/multi-top levels on the chart, with the unique ability to merge the levels from multiple charts and time-frames. For instance, if it’s displayed on 5 minute, 4 range and 800 tick charts, the 5 minute chart will display levels from all 3 charts.
If you can see when price and momentum have diverged, then you can evaluate when and where price may change directions. The SuperD indicator tracks seven different momentum oscillators. You don't even need to have any of the momentum indicators on your chart!
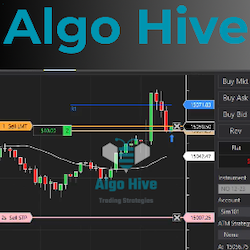
BurstAlgo is a straightforward and efficient automated trading tool designed to trade prop-firm accounts. It's built to preform up to three trades daily, focusing on consistent trading. This algorithm is all about keeping things practical.
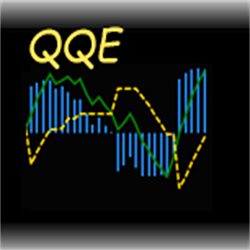
ATS QQE is a powerful Quantitative Qualitative Estimation (QQE) indicator with additional options which make it more versatile.
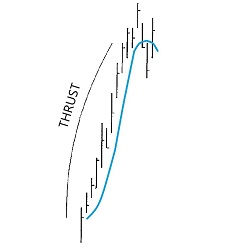
With this tool, traders can now find charts which have potential DiNapoli Directional patterns. Scan multiple markets & time frames in real time for Thrust and other patterns. Use as a chart indicator for easy recognition or as a market analyzer. Video instructions are included - try it today.
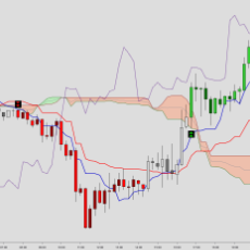
The Ichimoku Kinko Hyo, also known as the Ichimoku Cloud, is a versatile indicator that defines support / resistance, trend direction, momentum and trade signals. One can also think of this indicator displaying momentum in 5 separate time-frames.
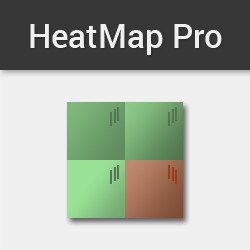
Simplify trading screens, and be the first to spot the trend. HeatMap is a tool that informs you when futures, forex or equities markets are all correlated in the same direction, or mixed. Know at a glance when follow through is high, or when the markets are sideways. Get the HeatMap now!
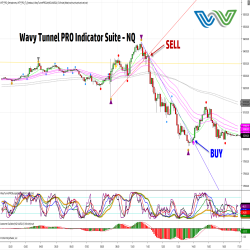
The Wavy Tunnel PRO ELITE Scanner Tools and Market Analyzer simplify finding trades. Set chart alerts for easy monitoring. The ELITE Tools save time by highlighting trades with visually appealing setups in line with the market cycles. Good for momentum, day and swing trading on all asset classes.
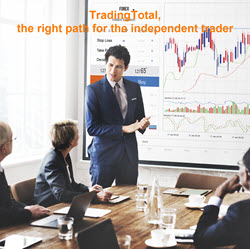
The program combines TradingTotal traditional technical analysis methodology with the latest technology automated systems & tools. It is carried out through intense online/onsite live seminars & webinars, 'EduHome' video recorded seminars, supportive coaching and a unique individual mentor program.
December 2, 2024
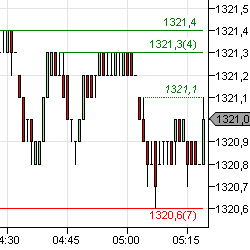
Mastering Sideways Markets With Auction Bars and Range Projections
November 19, 2024
Enhancing Your Automated Trading System: Key Insights from Best Pro Trade
November 14, 2024
NinjaTrader New Ecosystem Tools: October 2024 Edition
Enter Email for Updates