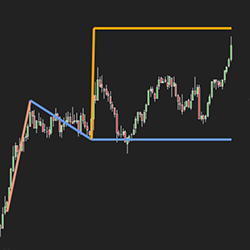
Measured moves are one of the most common trading strategies. However, they can be easy to miss. The Automated Measured Move Indicator from Tyche Trading takes away that difficulty, allowing you to focus on your trading. Never miss a measured move again. Get your seven-day free trial today!
We provide traders with an opportunity to earn live funding based on their trading performance in simulated accounts.
This ES S&P Day trading course uses Fibonacci technical analysis to identify entry and exit strategies. Rose has backtested for many years to determine the optimal Fibonacci Retracement and Extension levels for a consistent system. Get started with a free consultation with Rose!
3 indicators in 1! The C-Dash is a customizable, check-list style dashboard that comes with The Chompsky Bands Pro and Chompsky Fibs. Includes current ATR Current BPMs (bars per minute), an algorithmically weighted color wheel (weighting is customizable), and more.
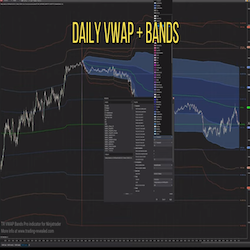
The VWAP Bands Pro indicator for NinjaTrader 8 is a must-have for traders who want to see the market map in real time along with precise support/resistance levels used by the big firms algorithm.
Trading OrderFlow delivers your ideas: your imagined automated strategy, semi-automated strategy or custom indicator. Turn your concept into an elegant solution adapted to your trading style and needs. Contact them about your development project for specialized service and expertise!
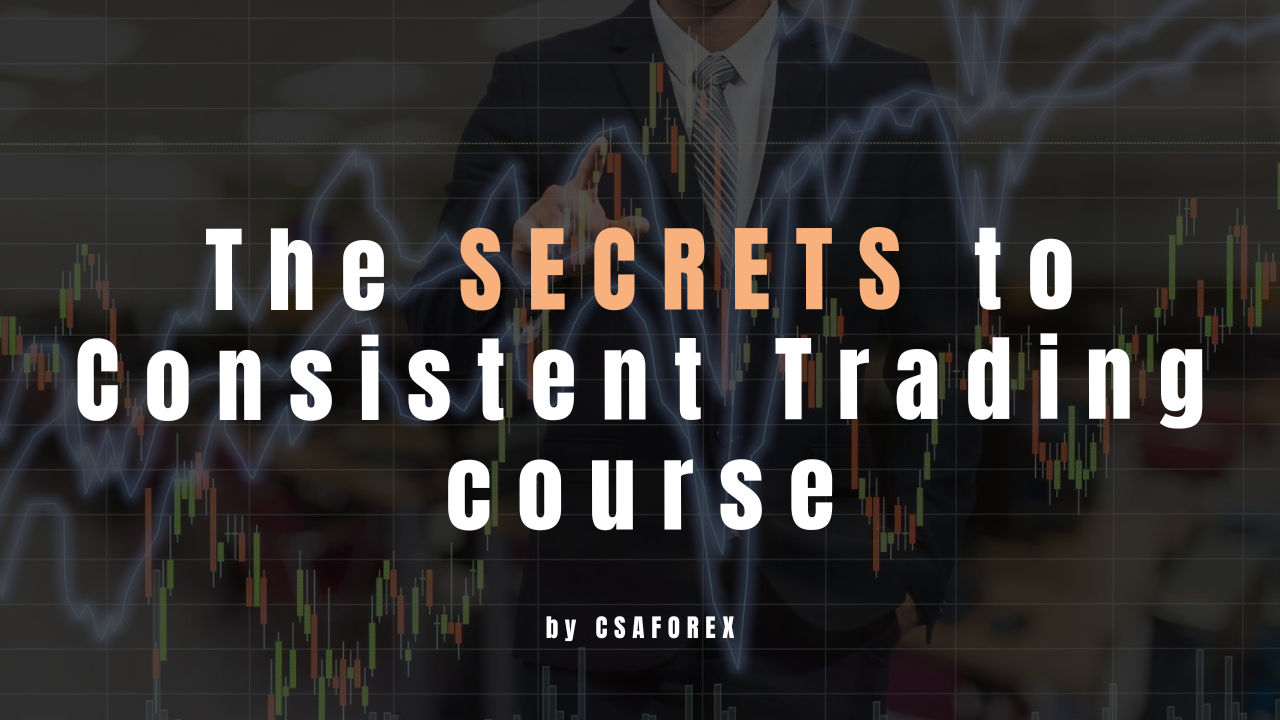
Everything you need to know about consistent trading video tutorial course. This course covers the following: How to use the Metatrader4 trading app, market Analysis (Fundamentals & Technicals), risk management, trading psychology (trading plan, journal, management, goal, etc.)
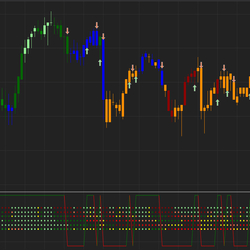
Gain a competitive edge via the proven performance of Wyckoff VSA and its fully customizable SMART package, which is configurable to your individual trading plan, style and strategy. Fully configurable SMART Technology. Advanced configurable trading filters. Advanced management tools.
Nordman Algorithms provides indicator and strategy programming services. Indicators for trend identification, trade zone detection, news impact calculation, price pattern visualization & more can be built, as well as extendable, maintainable systems that follow your trade strategy.
Simplify your trading & save monitor real-estate with the TradeFinder Market Analyzer Add-On. This tool drills-down to dissect & monitor multiple markets, timeframes & instruments to spot trends, momentum & price action in real time, complete with pop-up, email & audible alerts! Learn how!
December 2, 2024
Mastering Sideways Markets With Auction Bars and Range Projections
November 19, 2024
Enhancing Your Automated Trading System: Key Insights from Best Pro Trade
November 14, 2024
NinjaTrader New Ecosystem Tools: October 2024 Edition
Enter Email for Updates