ChartVPS provides high-end virtual private servers (VPS) to traders, enabling them to automate strategies & securely trade from any device, anywhere 24/7. Our servers & network are built specifically for trading & NT platform, ensuring compatibility, ultra-low latency & smooth operation.
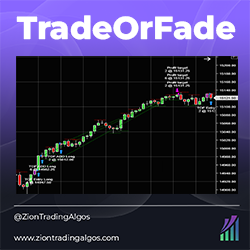
TradeOrFade is a momentum-based intraday strategy on the 5-minute chart. It determines whether or not there is an opening gap on NQ and takes advantage of statistically relevant information regarding gap ups and gap downs. It takes a starter position and pyramids into the position.
You can draw the risk/reward roulette tool at any point on a candlestick chart simply by clicking on the chart with the middle mouse button. This indicator allows you to speed up the drawing of the risk/reward tool on the chart by times, expanding on the functions of the trading platform.
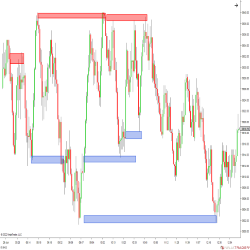
F.O Levels are one of two proprietary methods for locating supply and demand levels within the V-Zone Trading Course. F.O Levels are intraday supply and demand zones that may surprise you with their ability to consistently identify potential trades.
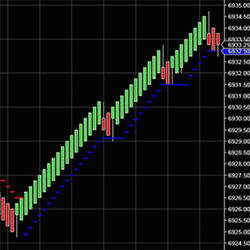
Trailing Stops move with the price action, not a lagging indicator. The indicator was designed for traders to use and to have no hassles of calculating your stop losses. The software does it automatically; never second guess the trend again. Can be used to lock in and protect your profits.
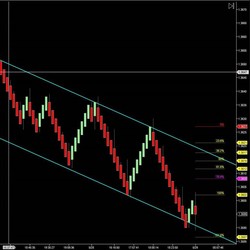
DTB Auto Fib Auto Trend automatically draws Fibonacci Levels & Trend Channel on the chart using Zigzag. Traders can adjust Fibonacci levels to chart margin as shown. By using this setting Fib Levels do not interfere with other indicators.
In this course you will learn how to code add-ons for NinjaTrader 8. It consists of over 10 lectures on how to create custom windows, pass data from strategies into add-ons, create beautiful charts using 3rd party libraries and use statistics to find new ideas for building systems.
A unique course with a specific, rule-based & mechanical/objective trading methodology. Designed to help traders identify entries & exits, define size, manage risk and control emotions when trading Forex Markets with their own characteristics & terminology. Get FREE access to the patented AutoUFOs®.
Get daily Volume Profile trading levels, monthly swing levels, signals and video! This is a video guide to Trader Dale’s daily levels with access to the member forum. It also includes custom-built Volume Profile indicators for NinjaTrader 8.
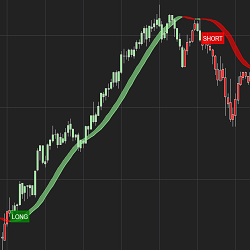
The HolyGrail Algo uses calculations of the Hull Exponential Moving Average to identify market direction. A long or short condition is printed on the chart and the strategy executes the trade by going long or short. You can set defined take profit, stop loss and trail and time of day to trade.
December 2, 2024
Mastering Sideways Markets With Auction Bars and Range Projections
November 19, 2024
Enhancing Your Automated Trading System: Key Insights from Best Pro Trade
November 14, 2024
NinjaTrader New Ecosystem Tools: October 2024 Edition
Enter Email for Updates