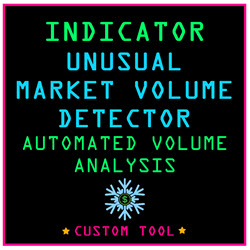
Performs real-time analysis of the volume and price trends to color the lower panel of the chart with actionable information. When both are trending in the opposite direction, the panel will be colored purple to mark this "unusual behavior." Start using this key Information in your trade plan today!
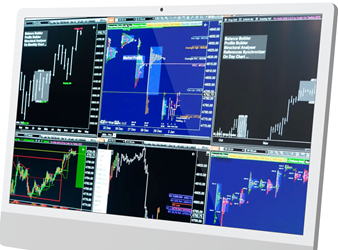
Elevate your trading with the ultimate toolset. The gold plan includes 9 NinjaTrader indicator modules and 13 NinjaTrader drawing tool modules. Seamlessly communicate between market profile and other charts. Utilize the top down approach analysis for daily, weekly, monthly and short-term charts.
These consulting services are tailored to meet the unique needs of trading companies, offering expert advice and innovative strategies to enhance performance and profitability. They provide in-depth market analysis, risk management solutions, and trading strategies designed to maximize your success.
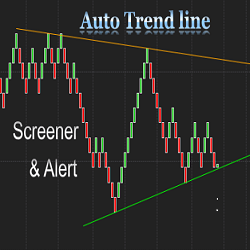
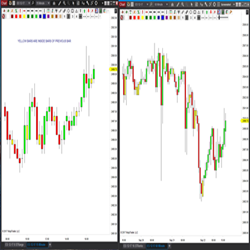
The Auto Trend Line Alert indicator will automatically plot the upper and lower trend lines based on the most recent swing points. It works on all timeframes. The NinjaTrader Market Analyzer makes it possible to track price action related to trend lines in any timeframe.
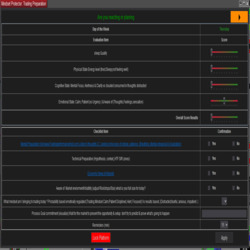
Fully customizable platform-integrated Trading Performance Toolkit that includes daily session preparation and mindset window, trade evaluation window, trader break reminder window, journal, emotional pattern and habit tracker, daily score card and performance stats window, account risk management.
The ST Inside Bars visually displays when a time-based bar forms inside a previous bar, also known as a Mother Bar. Learn more about ST Inside Bars today!
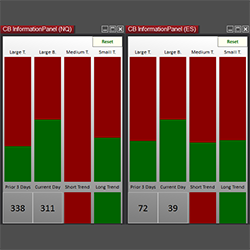
CB Information Panel gives you a snapshot of the buyers and sellers. Keep track of the prior day’s ranges and trend movement.
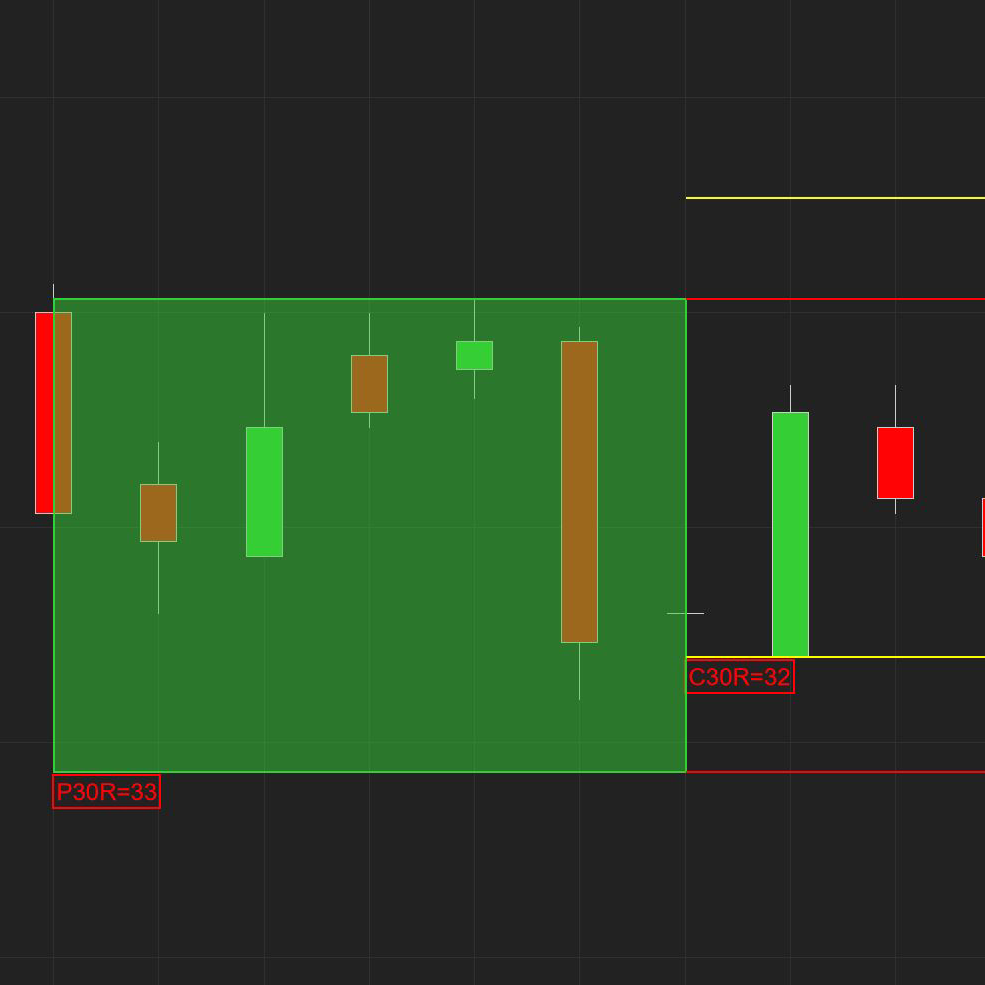
The purpose of the Free 30-Minute Range Indicator is to display visually the Previous 30-Minute Period and the Current 30-Minute Period's relationship to the previous period.
This product is a automated bot strategy that work on NQ and MNQ only.
The QTradez Consulting service offers guidance on the best way to create and support NinjaTrader add-on products. With over 10 years of NinjaScript development experience, QTradez consulting staff will deliver the exact information you seek as simply & cleanly as possible.
December 2, 2024
Mastering Sideways Markets With Auction Bars and Range Projections
November 19, 2024
Enhancing Your Automated Trading System: Key Insights from Best Pro Trade
November 14, 2024
NinjaTrader New Ecosystem Tools: October 2024 Edition
Enter Email for Updates