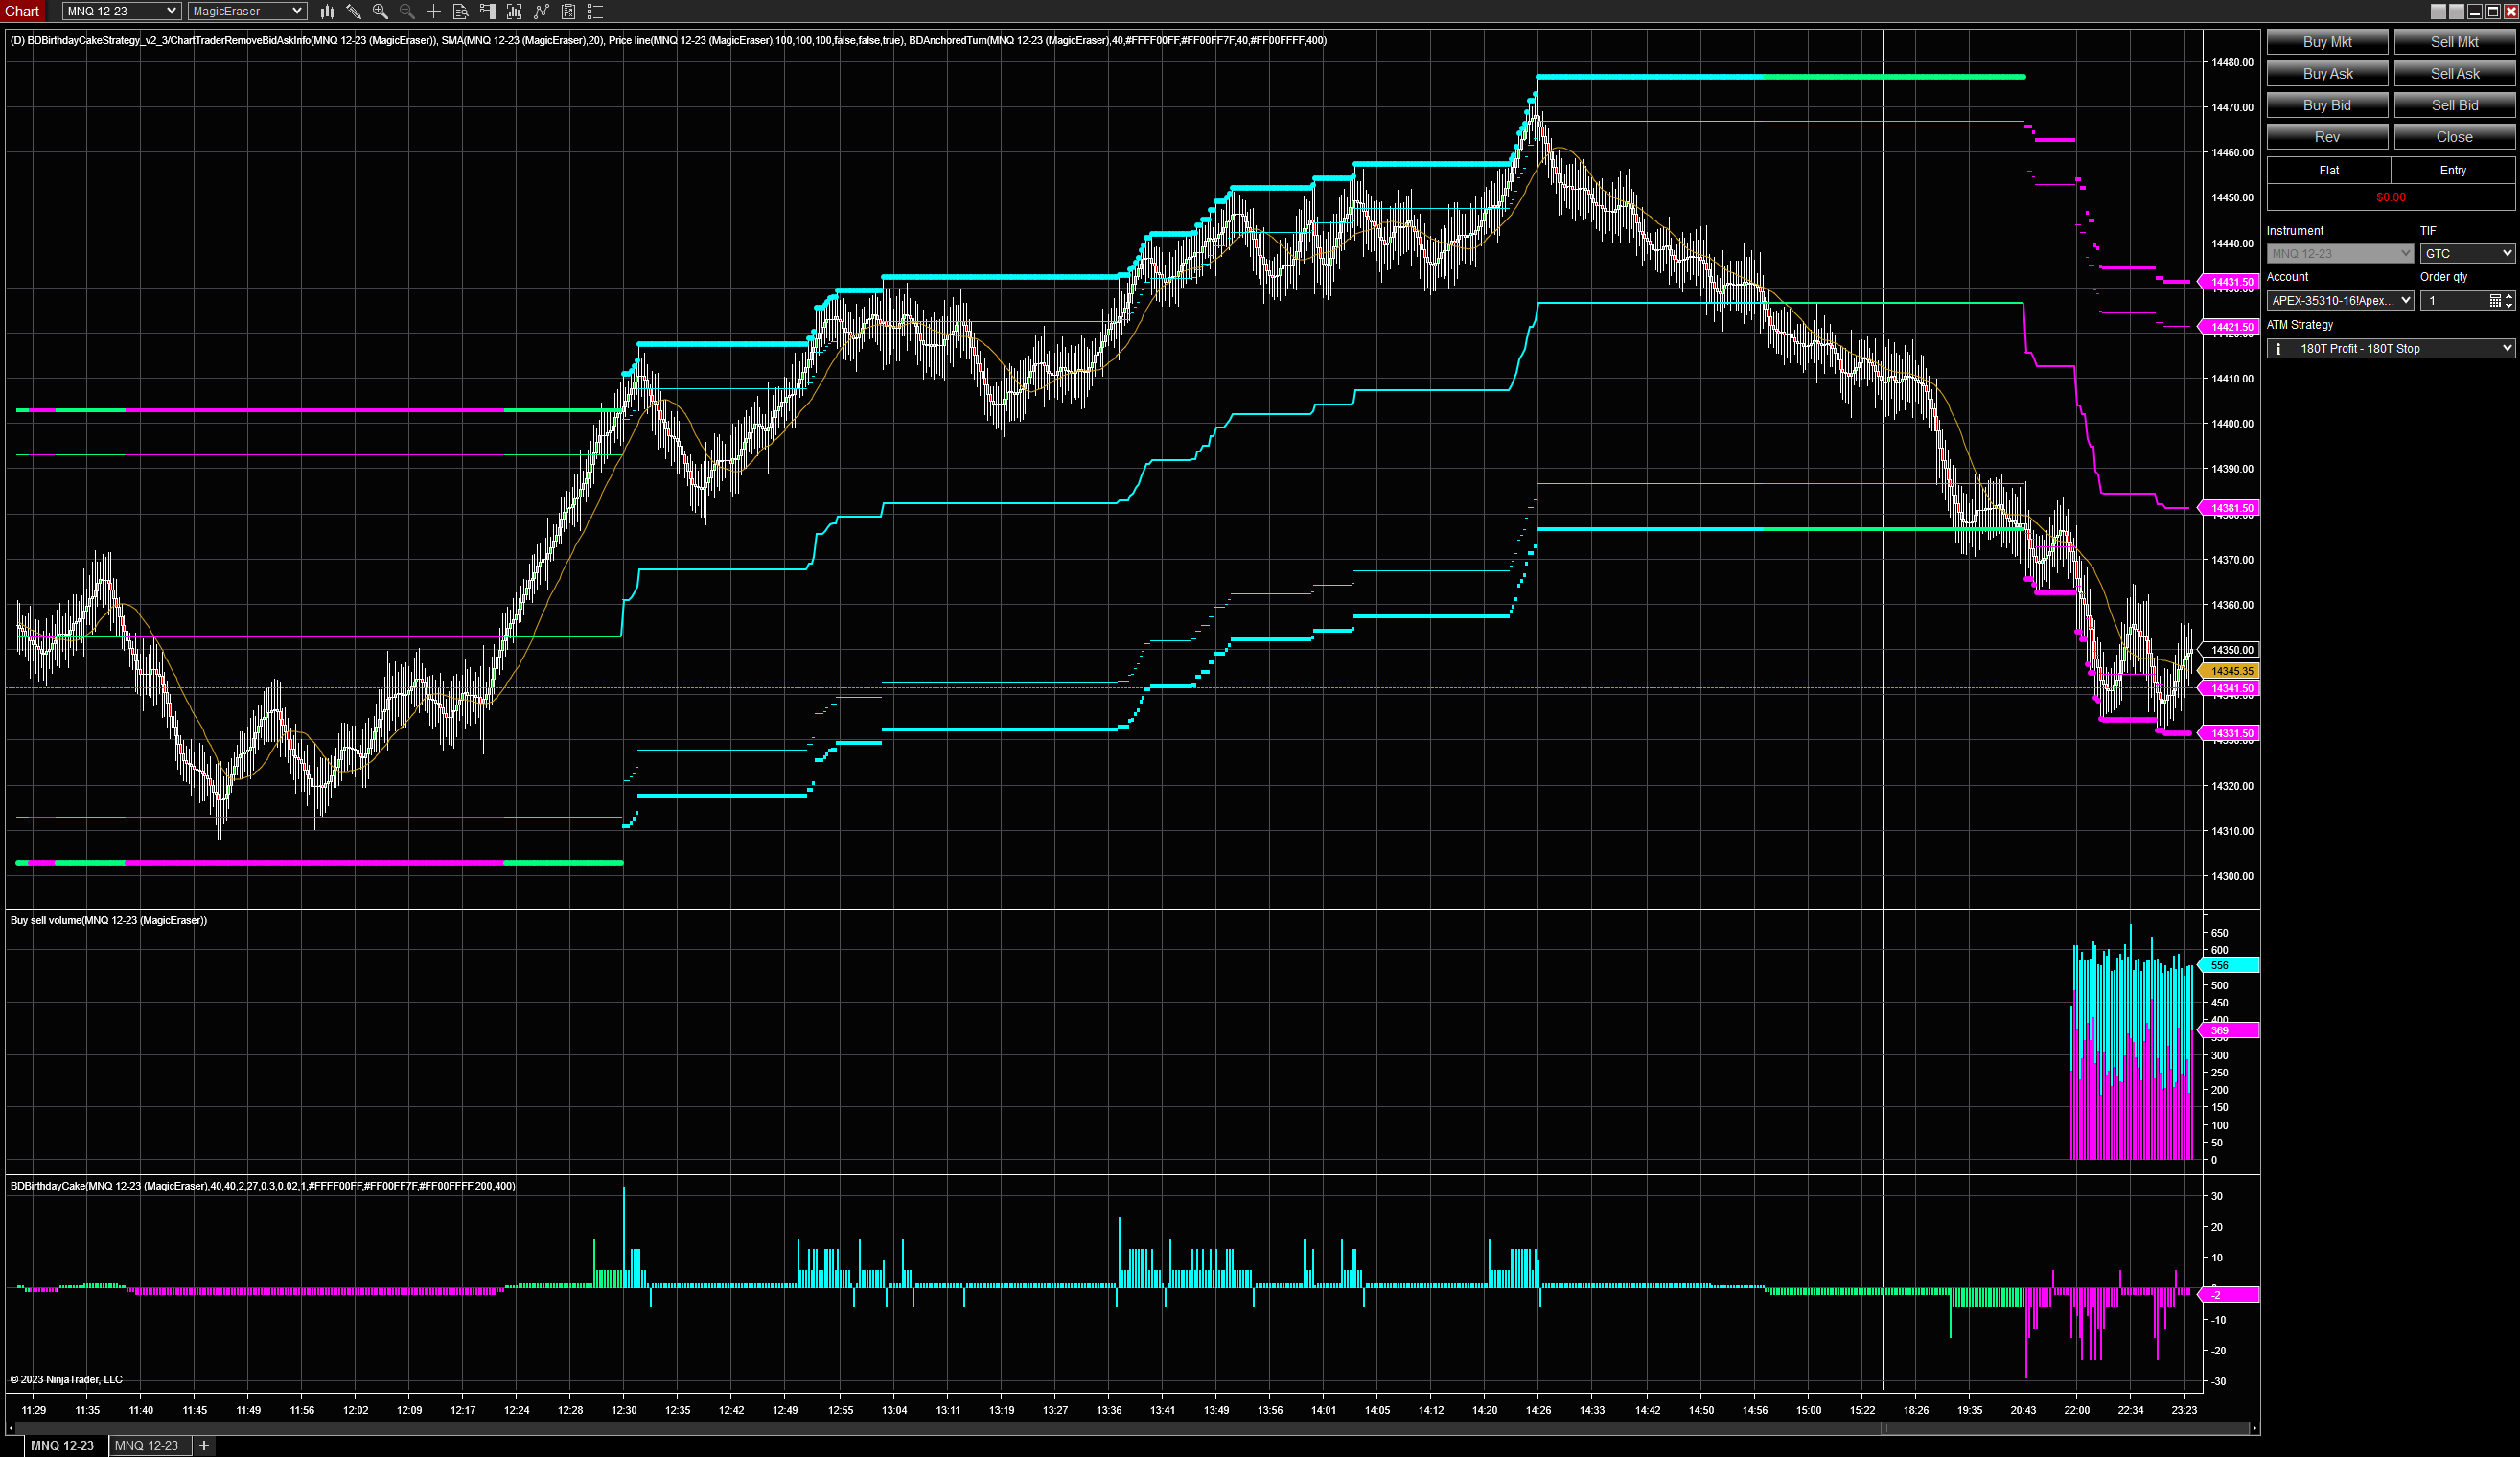
These bars reduce the number of reported crosses at a specific price due to wide spreads and fast DOM action. If your strategies require entries at a specific price you will find that these bars reduce the whipsaws in tick based bars.
You can now calculate how liquid a symbol is based on its trading activity and filter out risky instruments. A higher no of trades a day would mean that the instrument is drawing attention. Start using this powerful screener tool in your market analyzer today!
Education that includes beginner, candlestick analysis, how to place a trade, stair stepping, Fibonacci retracements, Fibonacci extensions and more.
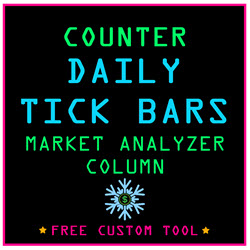
This indicator will visually tell you the evolution of this OrderFlow data: Delta / Delta Min / Delta Max. Ideal for detecting Delta divergences. No need to read the NinjaTrader statistics table anymore! Please note, you must have the NT8 version allowing access to OrderFlow.
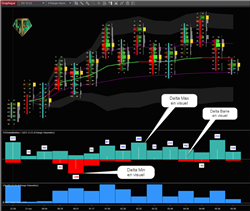
The Trendcators Indicator suite is designed to unclutter the market via built in analysis tools to pinpoint entry/exit signals with ease. It’s fully customizable providing you with the flexibility to determine which aspects of technical analysis are important for your trading! Get Started Now!
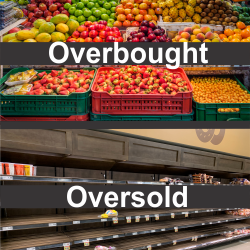
No subchart indicators or additional time frame charts are required to see when price becomes overbought or oversold. This helps the trader identify weakness in an uptrend or strength in a downtrend to anticipate a potential change in price direction. An award winning "heads-up display" indicator!
We have added two new products for market analyzer. One works in conjunction with DualTrend 2.0 to keep you aware what market is trending so you can trade with the trend. The other works with CB ZoneChart V5. It will let you know if your market is in the lower zone or Upper Zone.
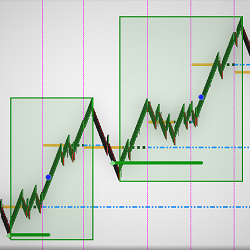
This tool and indicator helps you spot trigger entries with such features as one 4-range and one 14-range data series chart and one indicator. It's a simple, clean and very effective price-retrace system. Follow EdsRetracePlan to learn exactly when and where to buy or sell on price retraces.
An innovative way to analyze trading opportunities. Contextual trading keeps traders on the right side of the market. Qualified supply/demand zones work in sync with institutional traders. Enter trades with the shift of momentum. Learn and trade. Schedule a free consultation with the coach.
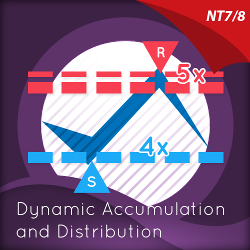
Dynamic Accumulation & Distribution plots graphically and numerically, how many times a price region has been tested. Levels tested more will appear as deeper lines, and levels tested less will appear as narrower lines, instantly revealing the depth of any accumulation or distribution region.
December 2, 2024
Mastering Sideways Markets With Auction Bars and Range Projections
November 19, 2024
Enhancing Your Automated Trading System: Key Insights from Best Pro Trade
November 14, 2024
NinjaTrader New Ecosystem Tools: October 2024 Edition
Enter Email for Updates