Turn your ideas into code! We work 1-on-1 with you to understand your needs and engineer a quality software solution that meets them. Automated strategies, indicators, data analytics, portfolio supervision – let us know your needs, we’re here to make it happen. Get in touch with us today!
T2SSupplyDemand is an indicator used to enter high-probability trades. Get notified in real time by email, text message or your favorite sound when the price is about to enter key zones & when it touches fresh zones. Don't stare at a screen, wait for the right signal in supply and demand zones.
One-stop software for beginner & advanced traders. Proprietary intra-day structure & logic. Advanced time & price signals, custom built for ES, NQ & RTY. The markets opened 100 years ago with the same day timespan as today. See a NinjaTrader webinar free at DMIC2059.com. Use code NTW for a discount.
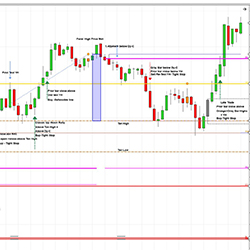
TWC Order Book Info graphically displays the number of orders in a Depth of Market (DOM). This widget shows the total number of orders, buy orders, sell orders, and the delta between them.
The experts say, "The Trend is your friend." DiNapoli Levels teaches you how to define ''Trend'.' The experts say, "Buy strength and sell weakness." This book teaches you how to buy weakness in an uptrend and sell strength in a downtrend, and of course, where exactly to take your profits.
Unlock your trading potential through Factor-Model Implementation & Quantitative Trading with Python! Master factor-based strategies for quantitative trading. Learn essential Python for financial markets, swiftly implement your ideas, and elevate your trading. Enroll now for a competitive edge!
Trend lines, swing pivots, and price patterns are simple price action trading tools that seasoned traders use daily. Day Trading With Price Action, by Galen Woods, is a high-quality trading course that teaches how to effectively trade via price action analysis. Download a free chapter today!
This custom BloodHound template is setup for the UniRenko Bar and waits to trigger signals as the market pulls back into the moving averages. The JATS X-RE-X Blackbox BloodHound Template allows you to execute at the specific EMA entry locations after pullbacks.
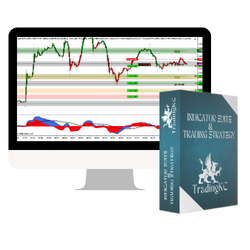
Simplify your trading with my strategy: trend, price action, support/resistance and momentum. Green/red bars indicate trend, custom ExCon indicator manages setups, pivots show support/resistance and MACD ties it all together. Clear entries, take profits and exits with simple rules for engagement.
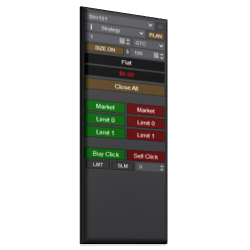
The Essential Chart Trader Tools is a starter pack for the Enhanced Chart Trader. It is full of features to help traders focus on decision making, remove stress and minimize mistakes. The Essential Chart Trader Tools can be added to any chart window in NinjaTrader.
December 2, 2024
Mastering Sideways Markets With Auction Bars and Range Projections
November 19, 2024
Enhancing Your Automated Trading System: Key Insights from Best Pro Trade
November 14, 2024
NinjaTrader New Ecosystem Tools: October 2024 Edition
Enter Email for Updates