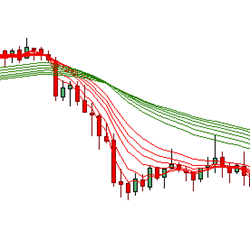
The Fanned Multiple Moving Average day trading indicator uses two sets of moving averages (long and short term) to calculate the probability of trend development, change, and direction. The FMMA reveals the nature of the trend and trend changes, which often reveals the starting point of a breakout.
Q-Scalper indicator identifies the confluence dynamics between Support and Resistance levels with significant Trendlines, providing very significant trade levels. These levels produce very actionable and valuable trade set-ups. Click the link to explore this great indicator.
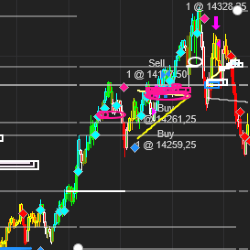
By automatically drawing significant price levels, such as ADR (Average Daily Range) min and max values, yesterday’s OHLC, pivot points (S1, S2, S3 and R1, R2, R3), and weekly OHLC levels, this indicator offers valuable insights to help you make more informed trading decisions.
Fully-automated. The VMX selects a time of day to trade during the cash session for stock index futures. This system takes advantage of the volatility created by big institutions moving asset allocations in the equity markets. All positions closed before the end of the cash session.
Save money by purchasing the Ultimate Account Management Bundle for NinjaTrader! This all-in-one solution combines their premiere Duplicate Account Actions trade copier and their top-rated Account Risk Manager at a better price!
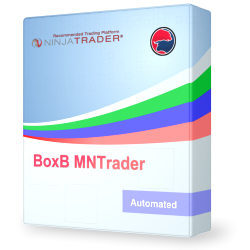
The BoxB MNTrader strategy is a fully automated trading system. Trading is based on the strategy of breaking through the box when forming a certain length and height. This system has several options for filtering: EMA, RSI, Stochastic, Arun Oscillator or Vortex.
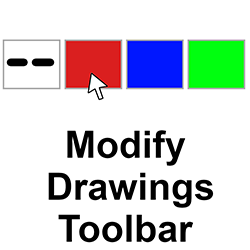
Trying to change line types and colors requires opening the properties box. It's also tricky to set a line or ray to be exactly horizontal. This toolbar contains various tools to help with those frequent property changes. It will even move your object endpoint to the chart's end.
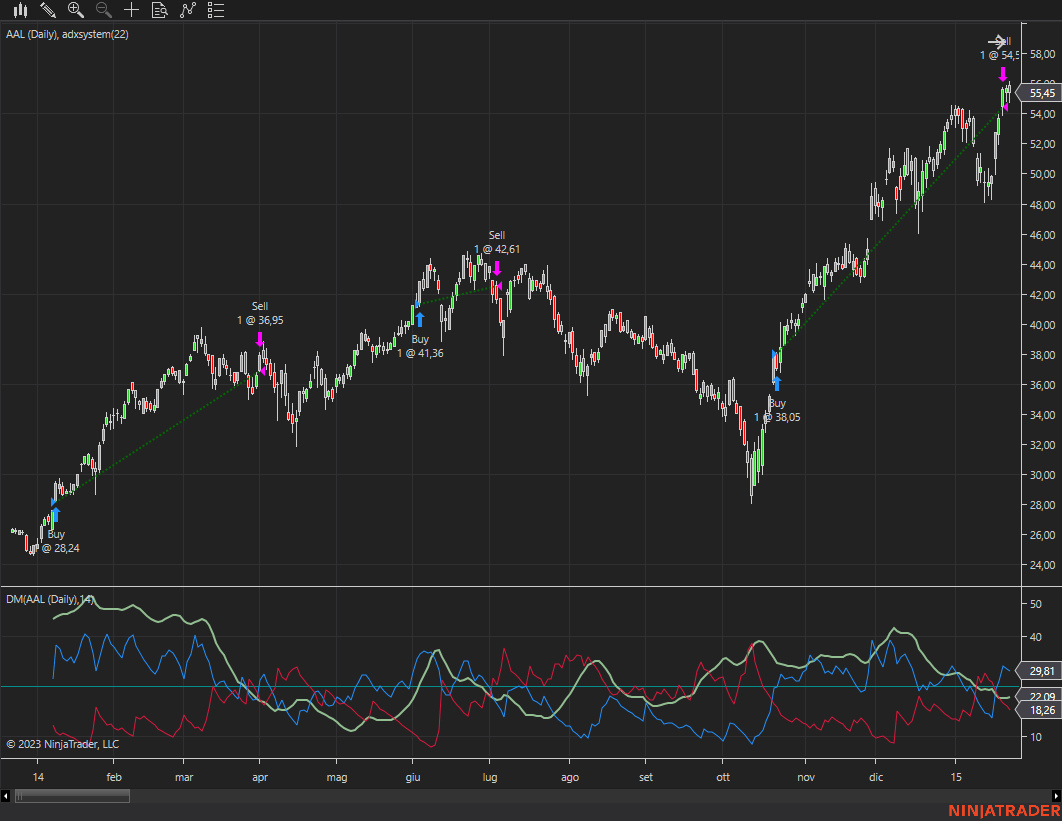
ADX trading system detecting price direction as well as trend strength.
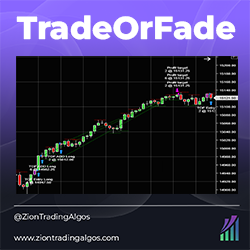
TradeOrFade is a momentum-based intraday strategy on the 5-minute chart. It determines whether or not there is an opening gap on NQ and takes advantage of statistically relevant information regarding gap ups and gap downs. It takes a starter position and pyramids into the position.
Track the open and close sessions of up to four different market times on your chart. A marker plots offset above and below the bar that corresponds to your time setting, which are all parameters that the user custom configures in the indicator properties window.
December 2, 2024
Mastering Sideways Markets With Auction Bars and Range Projections
November 19, 2024
Enhancing Your Automated Trading System: Key Insights from Best Pro Trade
November 14, 2024
NinjaTrader New Ecosystem Tools: October 2024 Edition
Enter Email for Updates