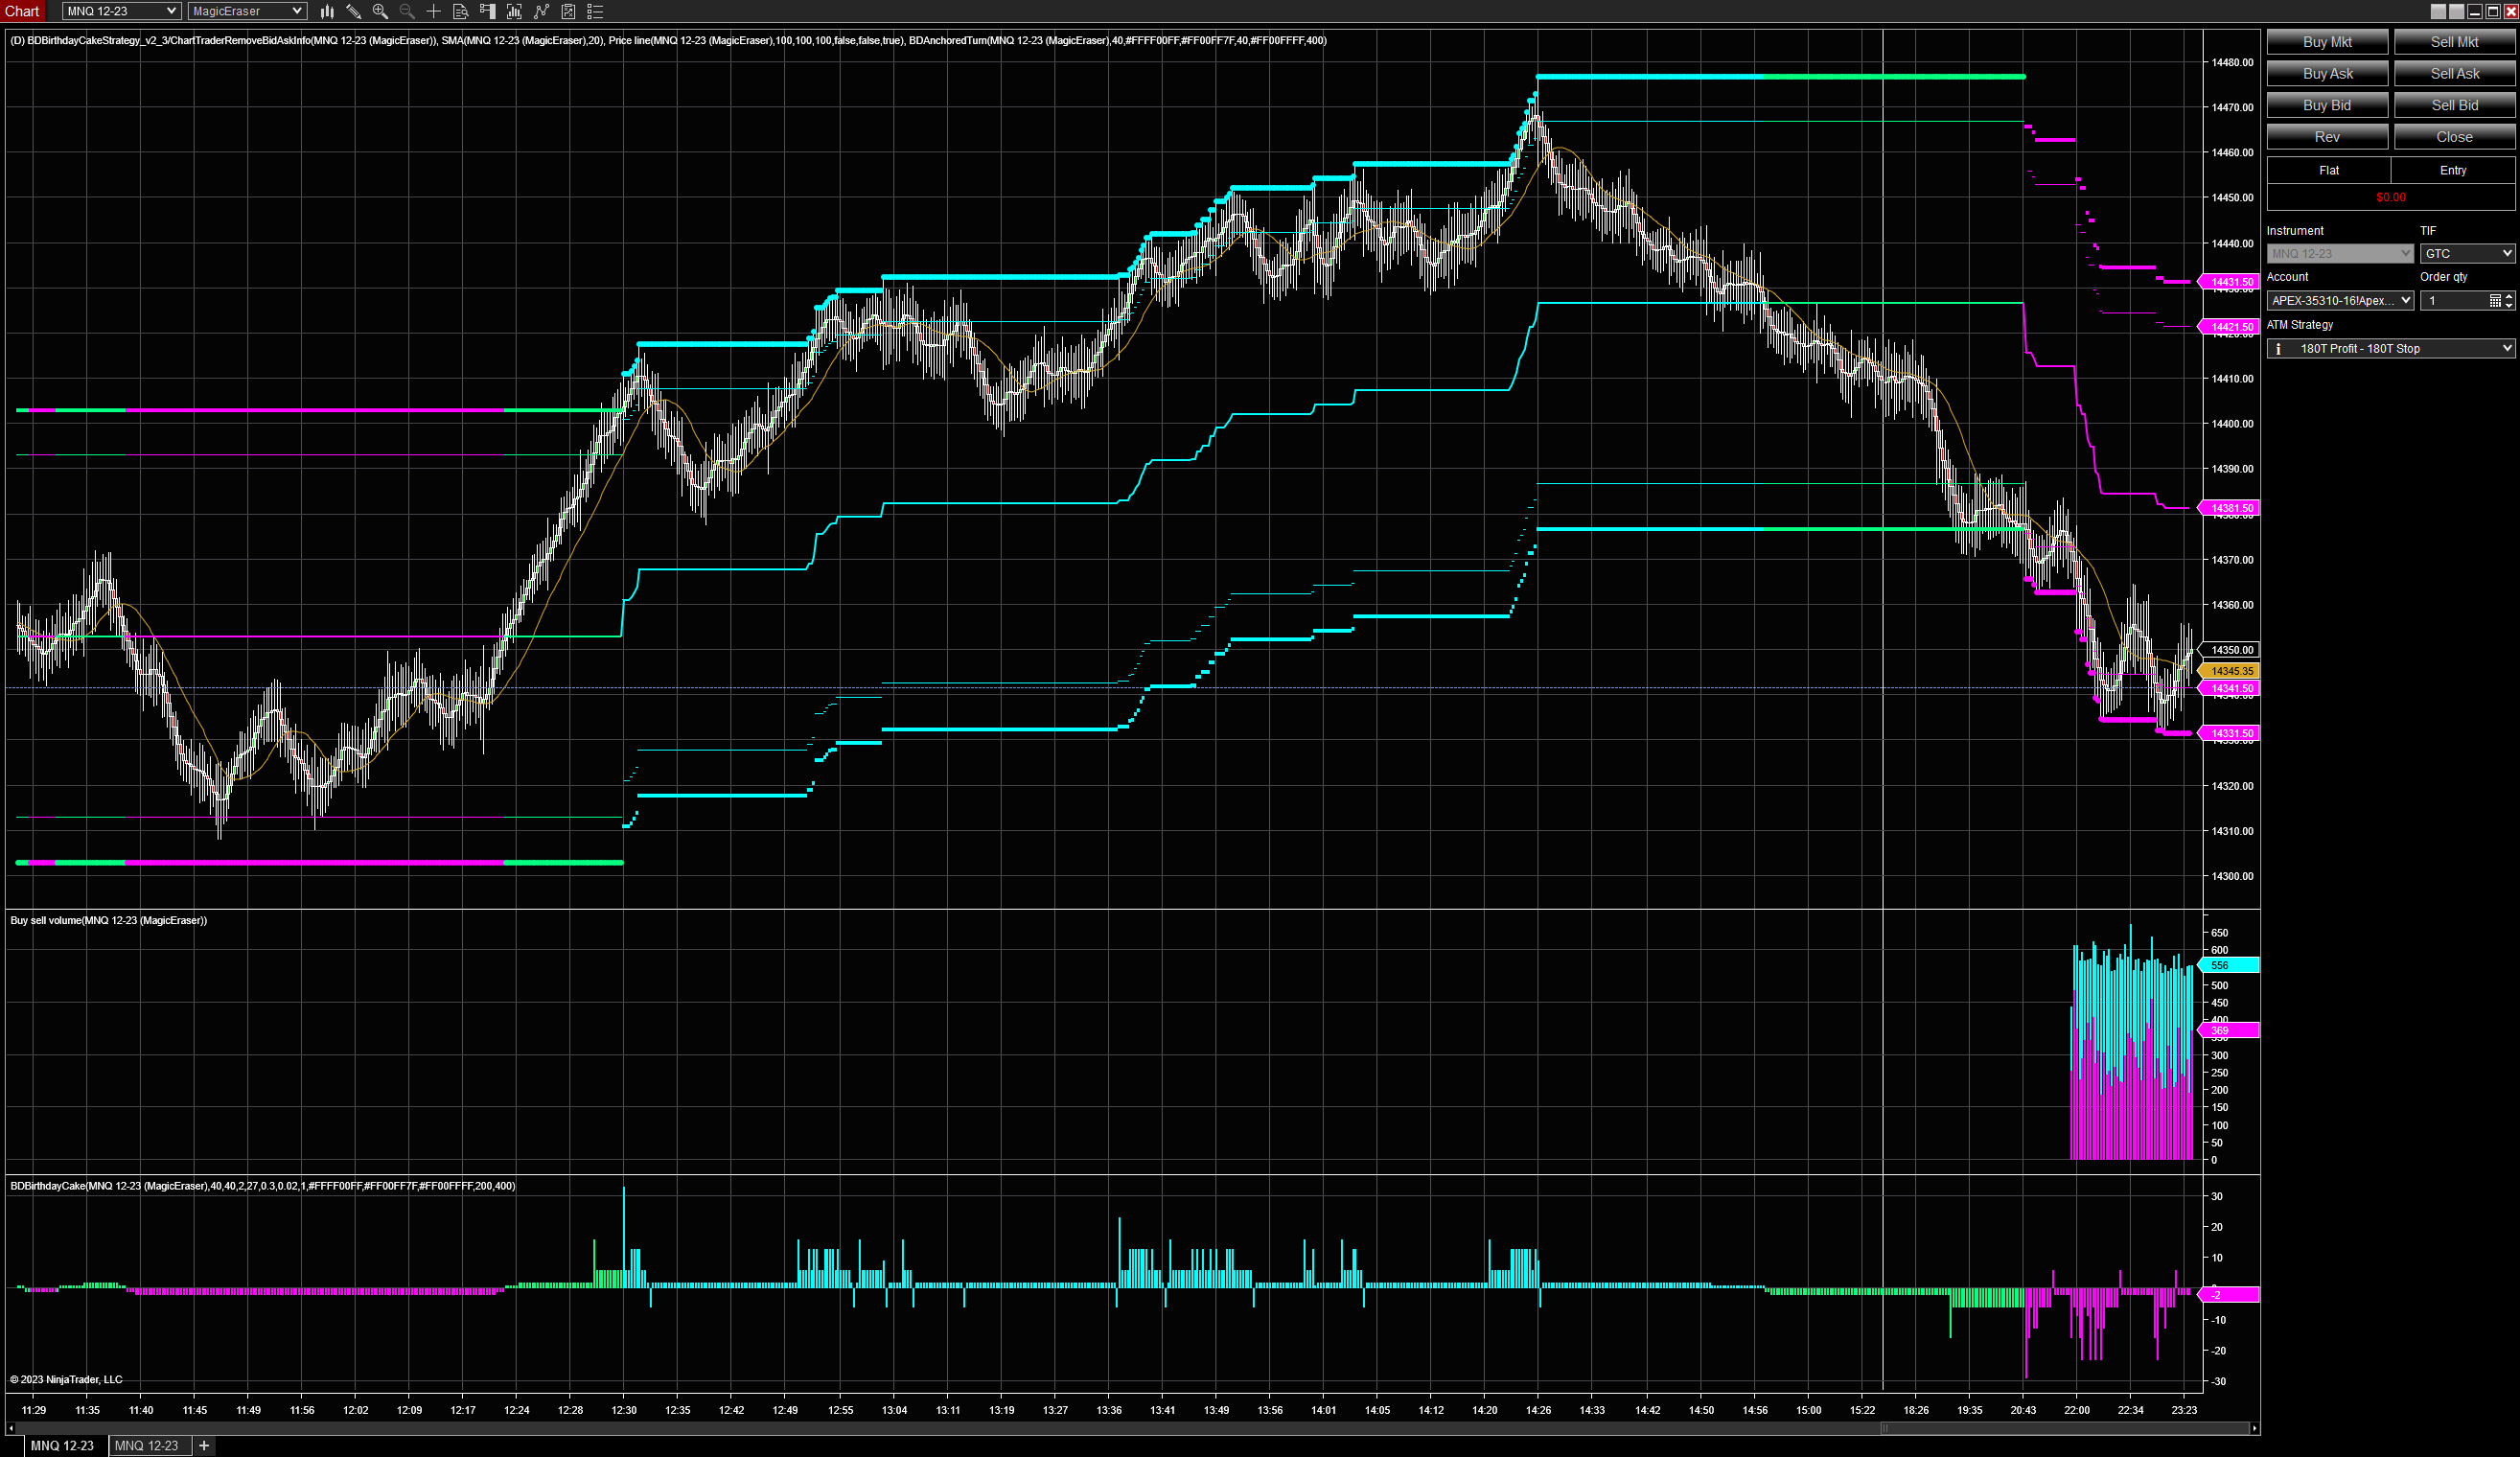
This anchored turn indicator makes it easier to identify the current trend for intraday trading, and provides multiple areas for precise entries. They use it internally for all of their trend based strategies and have been working on new scalping strategies, as well.
Die TrendTechnik® ist ein neuer eigenständiger und in sich geschlossener Fachbereich. Mit trendtechnischen Methoden werden Tradern sowie Analysten besondere Situationen sichtbar und nutzbar, die vielen Anderen verborgen bleiben. Erfahre mehr und nutze die deutlich besseren Möglichkeiten und Chancen.
ElliottWaveTrader offers a live Trading Room of market analysis, based on Elliott Wave principle. Founded in 2011, the site benefits traders looking to anticipate the direction of U.S. & world equity indices, stocks, bonds, metals, energy & more over a time horizon of several days to several months.
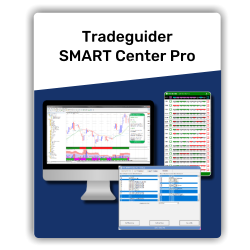
Gain a competitive edge via the proven performance of Wyckoff VSA and its fully customizable SMART package, which is configurable to your individual trading plan, style and strategy. Fully configurable SMART Technology. Advanced configurable trading filters. Advanced management tools.
Know that you’re an amazing trader but finding the funds to get started is the one thing standing in your way? At UProfitTrader, we can help! Simply choose the size account you’d like, show us what you’ve got through our unique testing process, then start turning your passion into a profession.
Plots chart and/or synthetic support and resistance lines from a higher time frame.
A category of automated tools designed for consistent rule-based trading management. Experience a structured approach to digital trading.
The VWAP Predator uses VWAP as a zonal guide with Bull and Bear Bands. It then uses logic to recognize accumulation and distribution candles. If those candles cross from a zone to another, then a Signal Candle is produced. Buy Signals in the Bullish Bands and Sell Signals only in the Bearish Bands.
Do you wish to diversify your trading by following in the footsteps of successful traders? Do you wish to keep your forex broker and still follow successful traders? Would you like to do this at a very reasonable cost? If you answered "Yes" then this is for you.
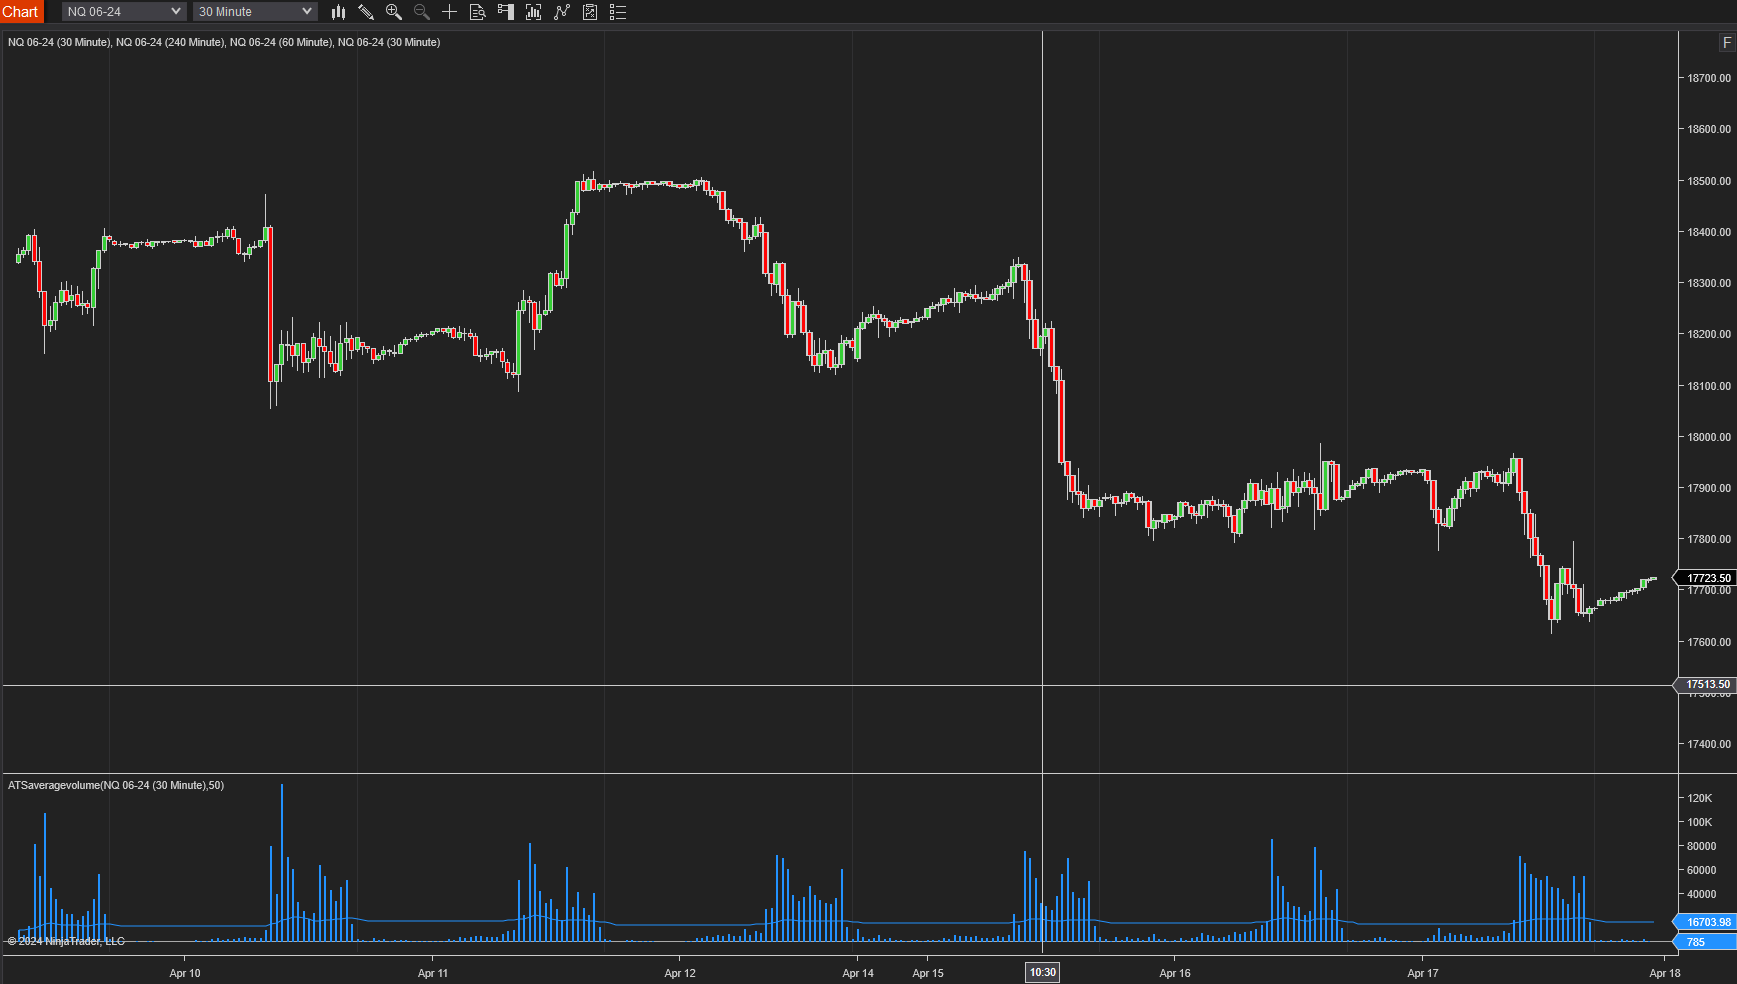
This indicator plots a 50-bar average of the volume overlaid on the current volume. You can change the number of bars used to calculate the average.
December 2, 2024
Mastering Sideways Markets With Auction Bars and Range Projections
November 19, 2024
Enhancing Your Automated Trading System: Key Insights from Best Pro Trade
November 14, 2024
NinjaTrader New Ecosystem Tools: October 2024 Edition
Enter Email for Updates