Do you want to overcome the challenges that often leave traders feeling overwhelmed and uncertain? Introduction to the Trader Brain will give you the practical knowledge to solve your money-losing patterns.
Trend lines, swing pivots, and price patterns are simple price action trading tools that seasoned traders use daily. Day Trading With Price Action, by Galen Woods, is a high-quality trading course that teaches how to effectively trade via price action analysis. Download a free chapter today!
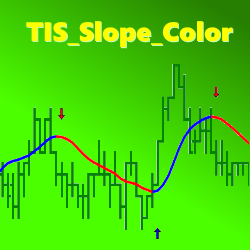
The TIS_Slope_Color indicator allows traders to detect the slope change of any line from any indicator. It can then paint the line, the background, or paint entry signals on a chart.
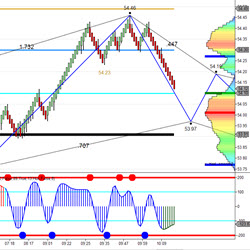
Ocean Theory considers all time frames simultaneously, and lets the market tell you which ones have the most significance, since that changes with time. Determine trend, pinpoint end of counter-trend moves for optimal entries, and apply natural moving averages. Sign up for a 30 day free trial!
Explore the vibrant world of NinjaTrader 8 Add Ons – a treasure trove of powerful tools crafted to elevate your trading game. Dive into an array of clocks, indicators and utilities designed to amplify your market analysis, fine-tune strategies and execute trades with precision.
tcVwap is an indicator for monthly, weekly and daily VWAP calculation. VWAP is an indicator representing fair price of a financial instrument. This is the Volume Weighted Average Price. The VWAP mean price is often used by institutional traders as a reference.
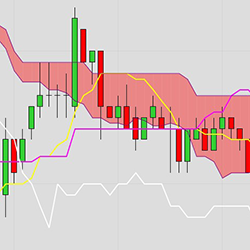
Free Ichimoku Cloud Indicator for NinjaTrader 8! This indicator can be used for both discretionary trading or as part of a NinjaScript based strategy. Download it today!
You can now calculate how liquid a symbol is based on its trading activity and filter out risky instruments. A higher no of trades a day would mean that the instrument is drawing attention. Start using this powerful screener tool in your market analyzer today!
Polaris Trading Group provides futures day trading education that includes an Online Study Course & Live Trading Room. Trading veteran and Commodity Trading Advisor (CTA), David D Dube, provides traders specific support & resistance levels & trade setups based on Market Profile and volume analysis.
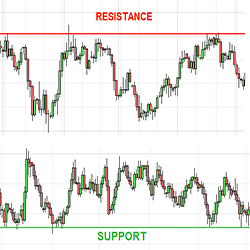
Plots chart and/or synthetic support and resistance lines from a higher time frame.
December 2, 2024
Mastering Sideways Markets With Auction Bars and Range Projections
November 19, 2024
Enhancing Your Automated Trading System: Key Insights from Best Pro Trade
November 14, 2024
NinjaTrader New Ecosystem Tools: October 2024 Edition
Enter Email for Updates