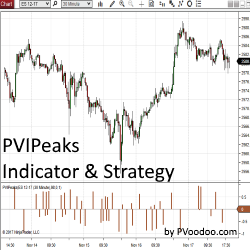
PVIPeaks Indicator and Strategy pinpoints peaks from any standard NinjaTrader indicator and allows traders to use them to generate a signal for an automated strategy. This tool is available exclusively for NinjaTrader 8. Get your free trial today!
A complete trader's toolbox of 8 custom indicators that are designed to give you a competitive edge in any market. Algorithmic components give actionable trade signals, trends and pattern recognition for day, swing, scalping or trend following trading styles in futures, forex and equities.
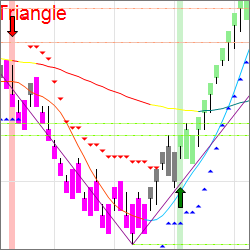
Gain a competitive edge via the proven performance of Wyckoff VSA and its fully customizable SMART package, which is configurable to your individual trading plan, style and strategy. Fully configurable SMART Technology. Advanced configurable trading filters. Advanced management tools.
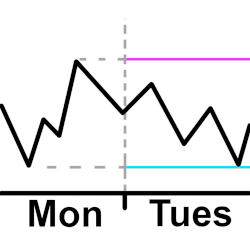
Plot a horizontal line for the high and low from the previous intraday. The user configures the open and close time they want to use for the intraday hours. This means the user can plot the high and low starting 30 minutes before the actual open and after the actual close if they want to.
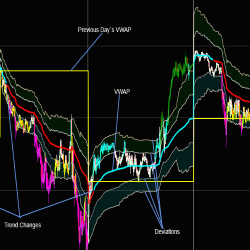
The Q-VWAP Indicator shows you accurate trend changes. The VWAP curve, along with deviation bands, give you accurate support and resistance levels. This indicator also accurately detects major breakouts. For more info, visit the Quaderr website.
Take emotion out of trading with auto/semi-automated trading. Use your own or recommended bars. Built in filters. Tradable on any futures market. Semi-automation for best consistency. Customizable ATM strategies, daily profit and loss targets. Great value for both beginners and experts.
David Misselhorn is a software developer with over 30 years of development experience in trading clients, market data and order-execution software. He writes indicators and strategies for individuals wishing to automate their trading and analysis activities.
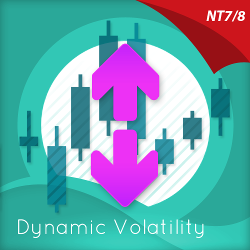
The Quantum Dynamic Volatility indicator paints volatility as price action unfolds - no more guesswork, no more nasty shocks. Watch and wait, then trade with this safety-first indicator!
Calculate your position size automatically by drawing a stop loss and entry and target levels on your charts – and, optionally, submit the associated orders. When the instrument currency is different than the account currency, it automatically calculates all amounts in the account currency.
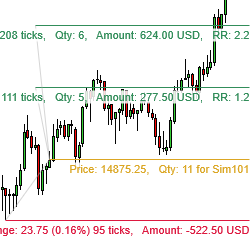
KingRenko$ is the real “face” of ninZaRenko. It has no artificial open and only real data, so you can see for sure the real OHLC of a KingRenko$ candle. As a result, KingRenko$ can be accurately backtested.
March 25, 2024
Trading Pullbacks and Reversals: Simplifying a Once Complex Retail Trading Strategy
March 21, 2024
VWAP Indicator: Average Price Shown Based on Price, Volume
March 18, 2024
Trade Copier Strategies: Make Efficiency Work for You When Futures Trading
Enter Email for Updates