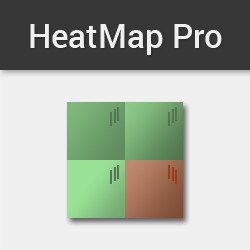
Simplify trading screens, and be the first to spot the trend. HeatMap is a tool that informs you when futures, forex or equities markets are all correlated in the same direction, or mixed. Know at a glance when follow through is high, or when the markets are sideways. Get the HeatMap now!
Automatically snap trade execution screenshots or take a snap at a set bar interval. SnapMyTrade assists traders with journaling and post trade analysis.
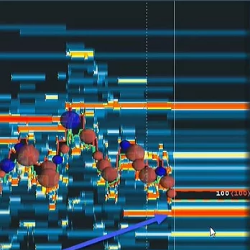
GAP/VWAP Fail is one of Scott's favorite stock setups that can be also applied to futures. A frequent & highly favorable risk-reward play that finds an additional edge by understanding order flow, watch Scott explain it in detail & demonstrate with multiple examples including entry & exit rules.
Douro Day Trading indicators are specifically designed for five minute chart trading targeting the European open, US premarket, US open and US. They are also designed for 5 minute, 15 minute and 60 minute combination trading, and produce up to 60 valid trades in a 24 hour period.
With no coding required, StratGen allows the everyday trader to generate strategies. In a couple of clicks, traders can generate strategies with over +1,000 signals at their fingertips. Generate strategies using indicators, price action, time of day, alternate exits and much more.
Universal Oscillator is an indicator that operates on the general principles of the RSI, CCI and OsMA oscillators. It helps you to identify potential upcoming reversals based on the values of the oscillator.
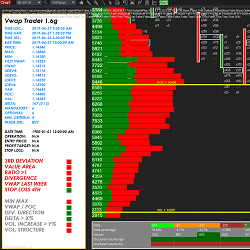
itcVwapTrader is a strategy for NinjaTrader 8 which is based on the mean reversion and the use of orderflow (vwap, footprint, market profile) for precise entries. This strategy uses more than 14 criteria for decision making. The strategy is highly customizable and comes in 3 versions.
Build, test & trade automated or discretionary systems in Futures, Forex & Equity markets. Generate concise trade signals while incorporating top day trading indicators. For example, use simple solvers to easily incorporate Fibonacci retracements from leading indicators. Start your free trial now!
This is a basic but powerful email training course aimed at newbies who want to get started in the world of trading and need a solid base of knowledge to help them survive the early stages of this business and increase their chances of success.
Increase your trading confidence by scheduling your one-on-one performance coaching and mentoring session with one of our seasoned and experienced traders. Beginner, intermediate or advanced topics can be discussed with our Certified Mental Performance Coaches.
December 2, 2024
Mastering Sideways Markets With Auction Bars and Range Projections
November 19, 2024
Enhancing Your Automated Trading System: Key Insights from Best Pro Trade
November 14, 2024
NinjaTrader New Ecosystem Tools: October 2024 Edition
Enter Email for Updates