Learn how Volume Profile works and use it to track big financial institutions who move and manipulate the markets. Learn my most favorite Volume Profile trading strategies. This book is written in poignant way with many illustrations and real trade examples.
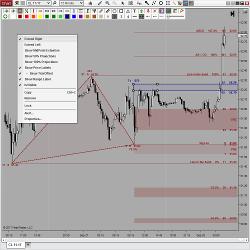
DrawBar Ultimate takes manual drawing, styling and chart analysis to the next level! It contains hundreds of options and 13 custom drawing tools including Volume Profile. All have multiple extensions, labeling, unique right click context menus, one click template switching and more.
This is a breakout trading strategy using an ATR trailing stop as exit.
Ocean Theory considers all time frames simultaneously, and lets the market tell you which ones have the most significance, since that changes with time. Determine trend, pinpoint end of counter-trend moves for optimal entries, and apply natural moving averages. Sign up for a 30 day free trial!
Get information about the development of a dynamic and descretionary trading model. This is intended to inform people of a coaching program tailored to their specific needs in order to make them more consistent traders.
Elevate your trading strategy with the Day Range Zones Indicator for NinjaTrader 8. Calculate potential daily trading ranges from the opening price using historical data and standard deviations. Identify key support and resistance areas, manage risks, and anticipate price movements.
Semi-auto trading tool used to help enter and manage trades when using Renko style charts. Customize entry condition, stops, targets, breakeven and trail.
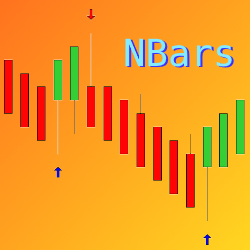
The TIS_NBars_UpDown indicator paints signals of the "OpenClose Setup" on the chart. It detects bar color changes and includes multiple filters for fine-tuning. See a video demonstration of the Nbars indicator in action.
The system looks for the highest high and lowest low over past bars, then the system tags the entry with a line that is proportional to your entry settings. Then the strategy calculates: Imbalance, velocity, momentum and probability.
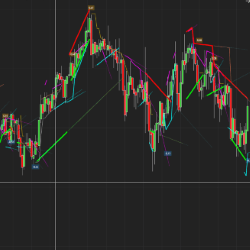
Trendlines can be drawn in so many incorrect ways. Drawing it incorrectly can make most trades losers and vice versa. Getting it right makes all the difference! QTL has a faster and far more accurate approach. Ready to automatically find the most accurate trendlines?
December 2, 2024
Mastering Sideways Markets With Auction Bars and Range Projections
November 19, 2024
Enhancing Your Automated Trading System: Key Insights from Best Pro Trade
November 14, 2024
NinjaTrader New Ecosystem Tools: October 2024 Edition
Enter Email for Updates