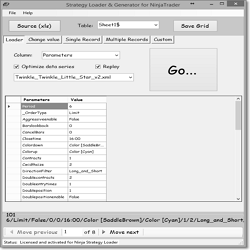
The Ninja Strategy Generator allows traders to make changes to the Parameters record that exports from NinjaTrader to create new strategies with slight variations of the strategy you wish to optimize.
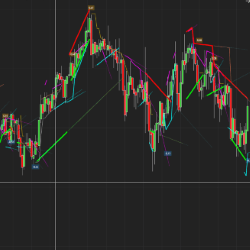
Trendlines can be drawn in so many incorrect ways. Drawing it incorrectly can make most trades losers and vice versa. Getting it right makes all the difference! QTL has a faster and far more accurate approach. Ready to automatically find the most accurate trendlines?
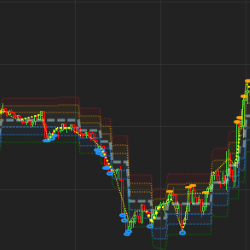
This indicator tracks the Smart Money flow in the market. Following the Smart Money provides a better understanding of the volatility size and trend direction. Ready to see what the Smart Money is doing?
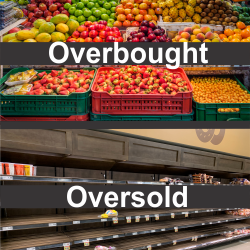
No subchart indicators or additional time frame charts are required to see when price becomes overbought or oversold. This helps the trader identify weakness in an uptrend or strength in a downtrend to anticipate a potential change in price direction. An award winning "heads-up display" indicator!
Using Renko/range/tick/volume bars? Optimal Speed analyses the length of time a bar took to form in order to highlight possible congestion areas. Instantly see the slowest bar of the session, slower-than-average bars, crawl bars and the slowest up and down bars of the day. Strategy compatible.
Do you spend hours reviewing charts and performing repetitive analysis and/or trade management? Why not define your trade setups and let me code them so that you get an alert each time a setup presents itself? Even have them built into an automated strategy.
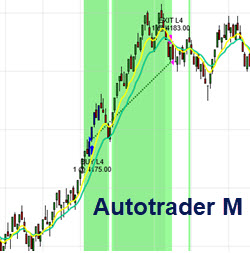
The AuToTrader M is an automated system for highly active traders willing to conservatively trade high-volatility future instrument (CL, ES, YM, etc.)The system comes w/ BACKGROUND M to track positions, a powerful money management module to protect profit & principal.Lease includes training, support
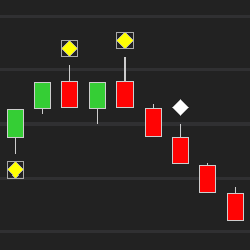
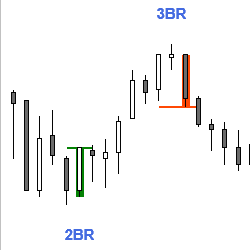
This indicator identifies 10 different signal bars or patterns for possible reversals by examining bar features and relation to prior bars. It can be used as a discretionary indicator or for automated (e.g. BloodHound) trading. Get started with a free 20-day trial today!
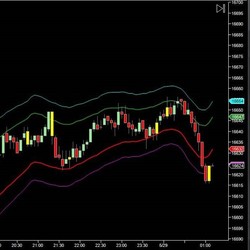
DTB Ultimate Bands is a next-generation of price envelopes that does all the heavy-lifting for traders. Once applied on a price chart, it pinpoints Overbought and Oversold areas with unmatched accuracy. Get a free trial!
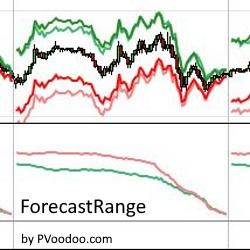
The PVForecastRange indicator calculates price moves and sets targets based on previous days’ statistical volatility. Try it for free!
December 2, 2024
Mastering Sideways Markets With Auction Bars and Range Projections
November 19, 2024
Enhancing Your Automated Trading System: Key Insights from Best Pro Trade
November 14, 2024
NinjaTrader New Ecosystem Tools: October 2024 Edition
Enter Email for Updates