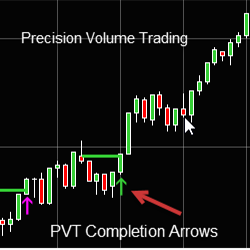
Precision Volume Trading Completions Arrows helps traders determine if the market will move up or down.
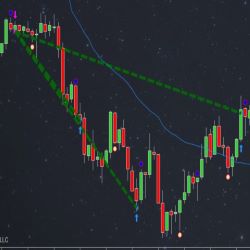
The Linear Regression Channel (LRC) is designed to truly detect when prices are overbought or oversold. Different than other LRC indicators, the width of the Stealth Traders LRC channel is based on a proprietary formula, designed to pinpoint opportune entry and exit signals. Upgrade Your LRC Today!
Trading Mentor is an automatic system based on data science which helps traders understand the most important insights of their trading and adjust their trading strategies for consistent results.
The Session Delta Pivot monitors the aggressive auction participants within a given session. By mapping this type of activity, the user can gauge the potential location for initiative activity as well as develop an understanding of directional day types.
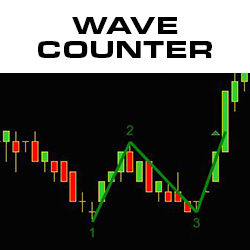
The Wave Counter indicator counts and paints waves in real time, revealing market trends, potential price reversals and no trade zones. The indicator emphasizes wave 3 as the main, informative wave, and creates a "chop box" when there are dueling waves. Download the Wave Counter today.
David Misselhorn is a software developer with over 30 years of development experience in trading clients, market data and order-execution software. He writes indicators and strategies for individuals wishing to automate their trading and analysis activities.
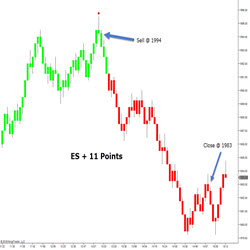
The ATS TrendReversal indicator predicts the end of a trend and reverse direction. The ATS Reversal combines multiple studies that measures distance, support, resistance and strength to pinpoint turning points in the market.
Automated Trading Strategy for trading MNQ.
This innovative tool from candlestick guru, Steve Nison, instantly finds his favorite candle patterns on charts. The Nison Candle Scanner works on all asset classes. Traders save hours of research time, spotting candlestick pattern opportunities immediately. Choose a monthly or lifetime purchase!
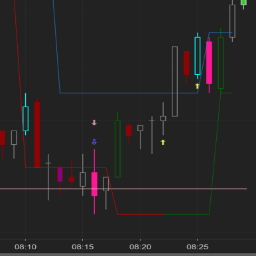
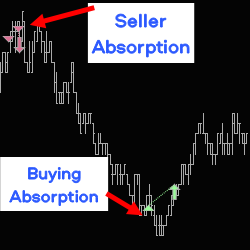
Absorptions are announced in real time with audible alerts and/or drawings on the chart. It also analyses backticking following absorptions. Adapt your trading zone live, with a toolbar on the chart. Strategy builder compatible.
December 2, 2024
Mastering Sideways Markets With Auction Bars and Range Projections
November 19, 2024
Enhancing Your Automated Trading System: Key Insights from Best Pro Trade
November 14, 2024
NinjaTrader New Ecosystem Tools: October 2024 Edition
Enter Email for Updates