Unlike other static or lazy stop-loss tools, the Dynamic Trailing Stop (DTS) uses a proprietary “Smart-Stop” technology intended to help protect profits while minimizing risk. Customizable "Stop Proximity" setting lets trader control how tight to keep their stop-loss.
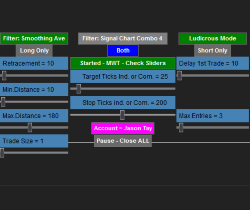
Maximize trading with Modena Wick Trader, offering total control, dynamic market adaptation and custom settings for optimal efficiency. Automation to the next level!
This is the ultimate mean Renko version (with wicks) for NinjaTrader 8. It removes noise and helps visualize trends. ninZaRenko can be used for charting, trading, backtesting, and programming. It is trusted and loved by thousands of traders worldwide. Download free now!
A unique course with a specific, rule-based & mechanical/objective trading methodology. Designed to help traders identify entries & exits, define size, manage risk and control emotions when trading Equity Markets with their own characteristics & terminology. Get FREE access to the patented AutoUFOs®
This course was designed with the objective of deeply studying the U.S Dollar futures contract in Brazil, techniques of operation using order flow, structuring of reasoning and strategies, self-knowledge and behavior adaptation for professional and consistent day-to-day evolution.
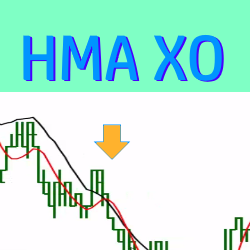
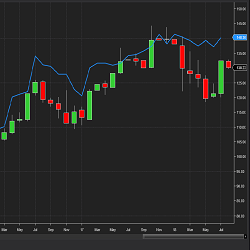
This trade setup indicator paints entry signals each time a Hull Moving Average (HMA) crossover occurs. The entry signals are customizable and can be filtered by the slope of the linear regression. Click here to watch a video and lean more!
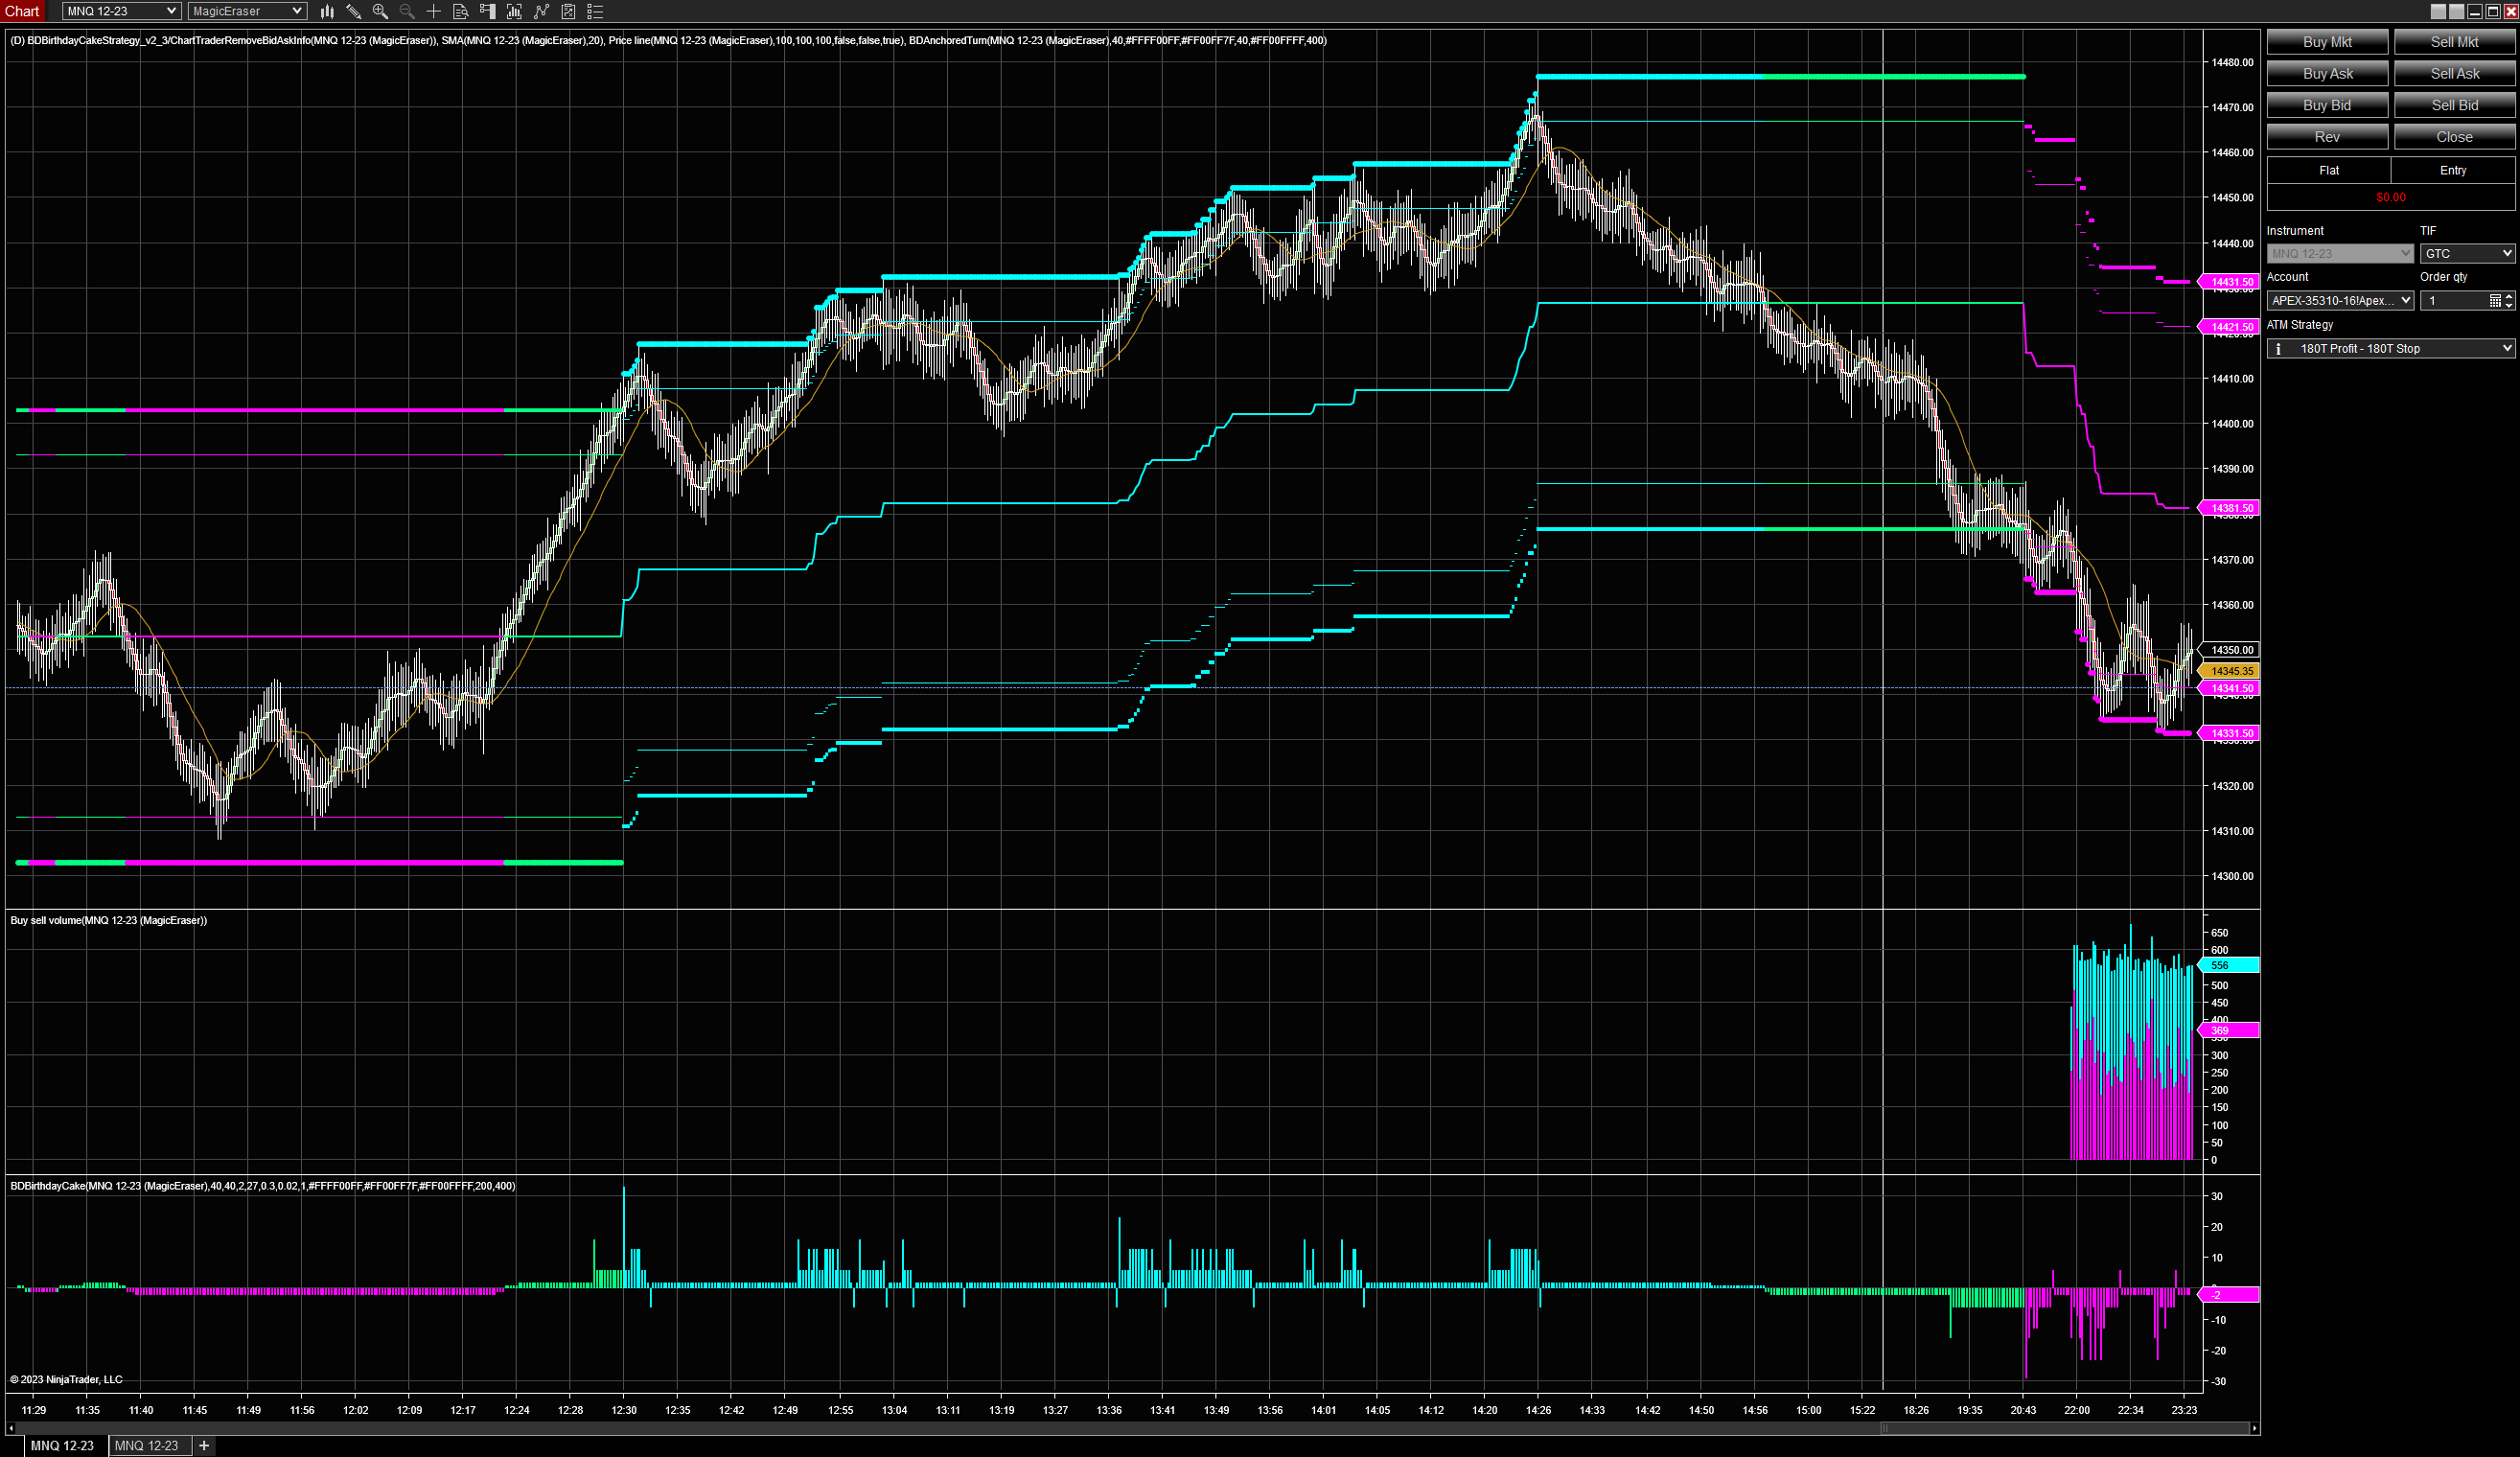
This anchored turn indicator makes it easier to identify the current trend for intraday trading, and provides multiple areas for precise entries. They use it internally for all of their trend based strategies and have been working on new scalping strategies, as well.
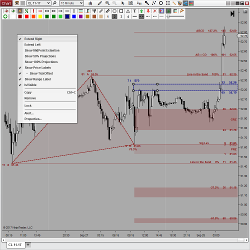
DrawBar Ultimate takes manual drawing, styling and chart analysis to the next level! It contains hundreds of options and 13 custom drawing tools including Volume Profile. All have multiple extensions, labeling, unique right click context menus, one click template switching and more.
The Smart Momentum NinjaTrader Indicator tool has a unique design compared to other momentum indicators. It uses an averaging mechanism that analyzes the cycle and adapts to it. This results in a momentum plot that is simultaneously smooth and sensitive.
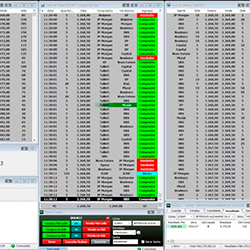
The StockCalcValuation indicator displays a fundamental valuation for the company you are examining. At StockCalc we value 8000 companies each night using 6 valuation models or data points and determine a Weighted Average Valuation from these calculations for display. Get your free trial now!
March 25, 2024
Trading Pullbacks and Reversals: Simplifying a Once Complex Retail Trading Strategy
March 21, 2024
VWAP Indicator: Average Price Shown Based on Price, Volume
March 18, 2024
Trade Copier Strategies: Make Efficiency Work for You When Futures Trading
Enter Email for Updates