An in-depth course specifically developed to trade Nasdaq futures using Bookmap.com and take advantage of its unique behavior, the NQ Order Flow course includes 3 hours of deep dive into all order flow patterns and how to exactly trade them, exhaustions, absorptions, spoofs, book flips and more.
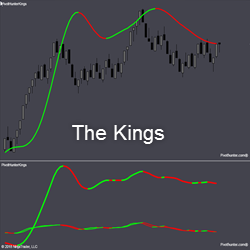
THE KINGS include King 1, 2, 3, and 3Kings. They measure order flow at 3 levels, then combine all three into one - The 3Kings. The bottom panel shows Kings 1, 2 & 3. The top panel shows them combined into The 3Kings. This provides traders with a very smooth indication of order flow.
LogikBarProfiler is a feature-rich bar volume / tick / price distribution heads-up display analysis tool. It displays data computed within each bar, as well as buyer v. seller distribution at price levels. This combines the usefulness of POC, delta, and activity analysis into one intuitive tool.
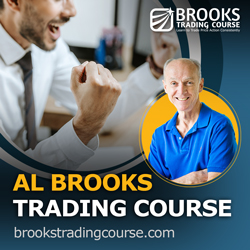
Master price action trading with Al Brooks' extensive video course. Over 100 hours and 52 modules cover E-mini, Forex, commodities, and more. Gain practical strategies and expert insights to enhance your trading skills. Join today and trade with confidence.
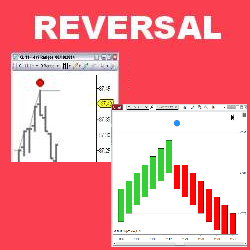
This indicator detects possible reversal bars using Stochastic overbought & oversold conditions & paints entry signals in real time. The Stochastic levels are fully customizable & each reversal signal features a horizontal Reversal Breakout Order line marking sell stop entry levels. Try today!
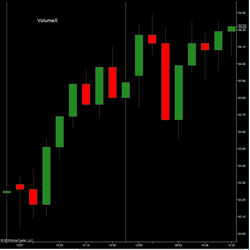
The LogikVolumeX utilizes signal processing and price reconstruction techniques to cut through the noise, reconstructing the true transaction, minimizing the hiding of large orders. This allows traders to identify & react to the market sentiment, and correlation between price & volume development.
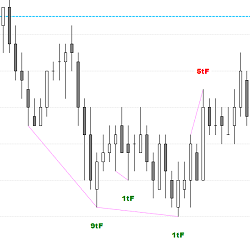
This indicator is a new approach to Price Action trading. It shows Tick Failure Breakouts above swing highs and below swing lows, which can act as support/resistance. Use the Tick Failure Breakout indicator as a discretionary indicator in your Day Trading. Get Started with a free 2-week trial today!
The Volatility Bands indicator attempts to present a way to measure and visualize volatility, using standard deviations (σ) and average true range indicator, and aims to point out areas that might indicate potential trading opportunities. Click to learn more.
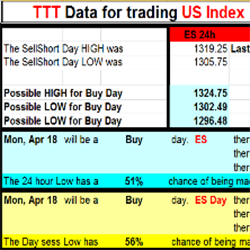
Based on the trading techniques of George Taylor, the TTT E-Book provides the necessary data to trade using the Taylor Trading Technique. After the market close receive 24 hour and daily data to plan your trades for the next trading session. Free 1-week trial available!
Power Wicks, utilizing Volume Profile and Order Flow, provides a comprehensive analysis of buying and selling dynamics within each bar. It carefully examines market imbalances and plots a wick from the High to Low, extending to the intra-bar VWAP whenever a significant imbalance or a shift occurs.
December 2, 2024
Mastering Sideways Markets With Auction Bars and Range Projections
November 19, 2024
Enhancing Your Automated Trading System: Key Insights from Best Pro Trade
November 14, 2024
NinjaTrader New Ecosystem Tools: October 2024 Edition
Enter Email for Updates