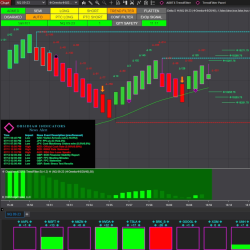
The Oil Trading Room is a product of Robbins World Cup Champion Trader Rob Mitchell. It has a unique Scientific approach with Trading Signals, Indicator applications using Market Profile, Price Action, Order Flow, Momentum, Order Flow Momentum, Support Resistance, Market Mapping and more.
Unleash the power of automated trading with the Obsidian Indicator Suite for NinjaTrader 8. A collection of innovative indicators, including the Automated Dark Diamond Trend Sniper, specially designed for precision and adaptability in different market conditions. Start your 7-day free trial now!
Learn a battle-tested strategy for trading the markets in under 60 mins per day. Here’s just a fraction of what you’ll learn: How professional traders find good trades, how to read the markets and a market that has unique advantages over others.
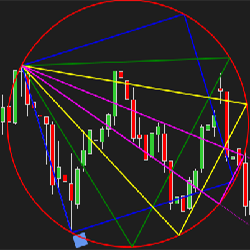
We are pleased to bring NinjaTrader users this tool typically reserved for expensive institutional platforms. The Gann Emblem is a drawing tool for those familiar with its applications, especially traders of the Gartley method.
Q-Scalper indicator identifies the confluence dynamics between Support and Resistance levels with significant Trendlines, providing very significant trade levels. These levels produce very actionable and valuable trade set-ups. Click the link to explore this great indicator.
Unlike other static or lazy stop-loss tools, the Dynamic Trailing Stop (DTS) uses a proprietary “Smart-Stop” technology intended to help protect profits while minimizing risk. Customizable "Stop Proximity" setting lets trader control how tight to keep their stop-loss.
Market Analyzer Column: Effortlessly tailor real-time market data to your needs.
The algorithm works by continuously processing live data such as time & sales, volume, tape pace and tape acceleration. The algorithm performs real-time analyses, dynamically adapting to identify aggressive buyers and sellers actively influencing the market.
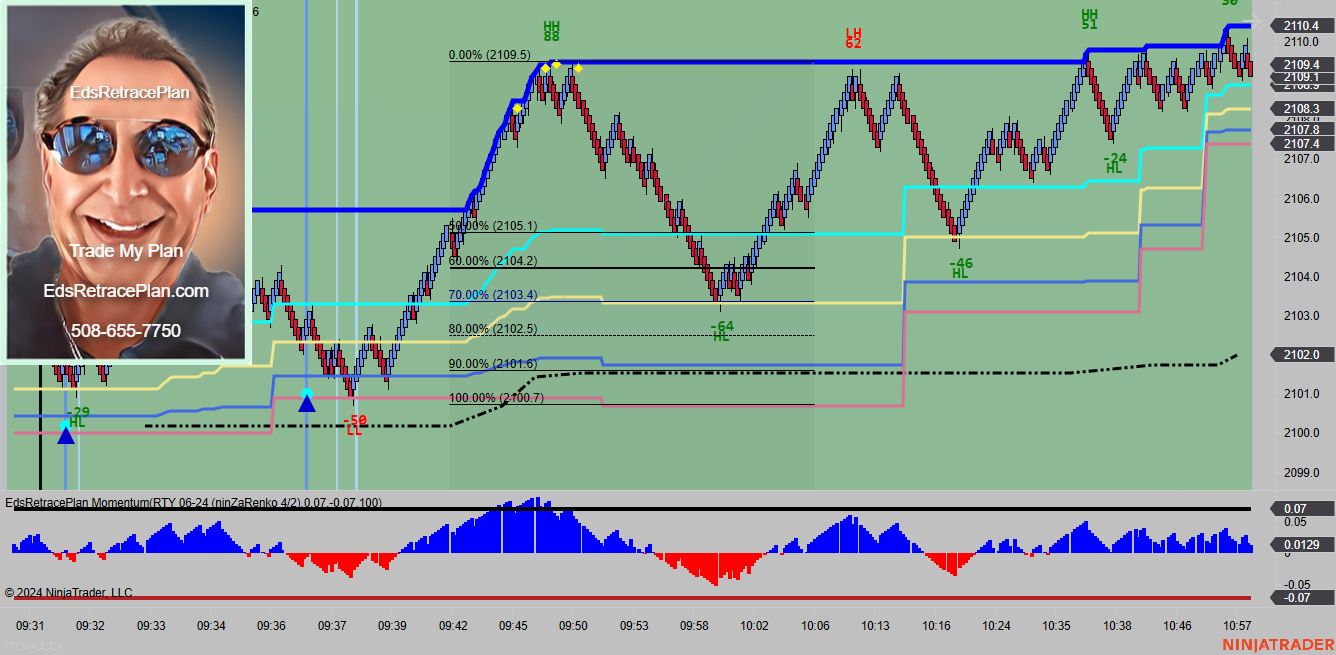
EdsRetracePlan Momentum Reversal Indicator is for day trading ES, YM, RTY, NQ, CL and GC. The indicator identifies reversal trades by finding and marking tops and bottoms. These trades signal the end of a move and opportunities to get short at the highs and long at the lows.
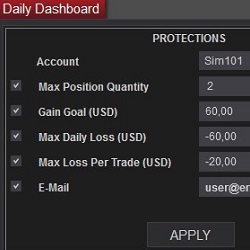
Protect your losses in a trade and daily basis. Do not grow a position more than planned. Daily Dashboard is the tool to support you against your bad behavior in the stressful moments.
December 2, 2024
Mastering Sideways Markets With Auction Bars and Range Projections
November 19, 2024
Enhancing Your Automated Trading System: Key Insights from Best Pro Trade
November 14, 2024
NinjaTrader New Ecosystem Tools: October 2024 Edition
Enter Email for Updates