The Emet Trading Solutions team of experienced programmers specialize in converting existing indicators, strategies or code from cAlgo, MetaTrader, TradeStation & MultiCharts to NinjaTrader 7 or NinjaTrader 8. Get a free quote for your project today!
PFAZoneSuite is advanced supply and demand trading! Indicator package includes automated volume zones, volume profile, order flow analytics, trend lines, fibonacci retracements, market structure, trade data box and more! Compatible with NinjaTrader 8. Click here for a free demo!
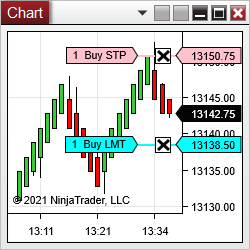
Clicker allows one to enter orders with one click directly on the chart! Modifier keys and mouse buttons for buying and selling are configurable. The order type is detected from the clicked price relative to the market price. All order parameters come from ChartTrader. Free trial for seven days.
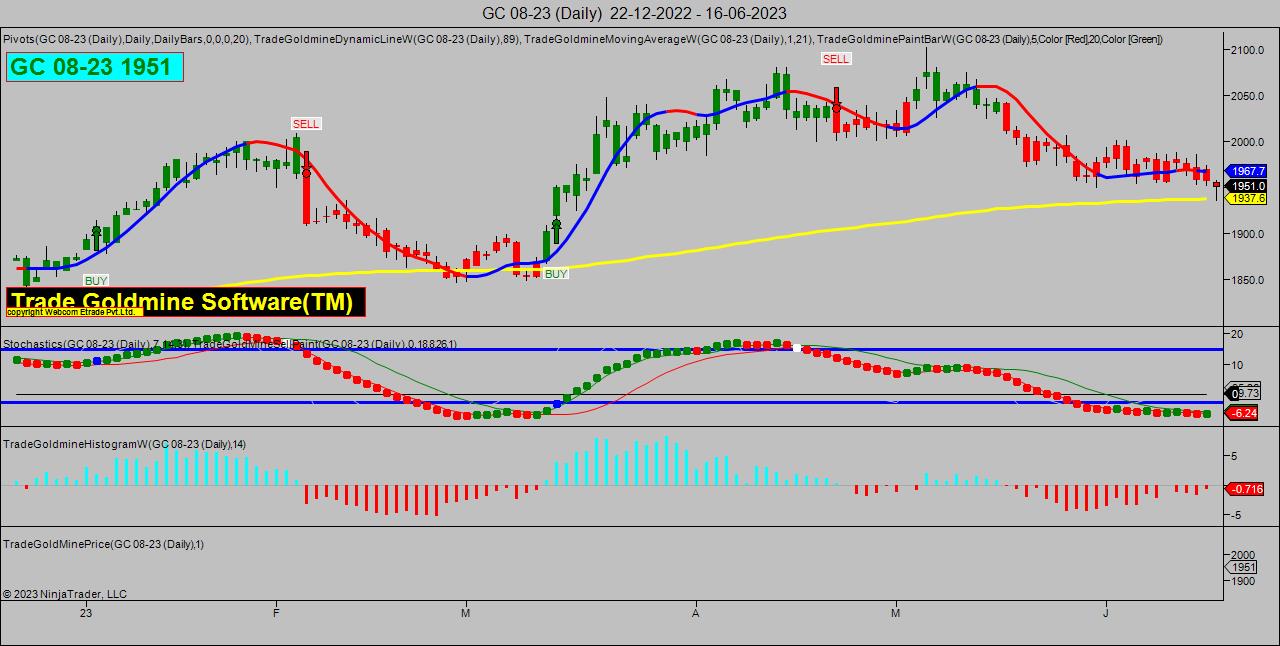
GOLDMINE NINJA TECHNIQUE software is a technical analysis tool that gives user-friendly BUY-SELL signals to traders and helps find perfect resistance & support levels in order to trade more effectively.
Download a 14-day test period of this trading indicator that identifies points to enter the market for price pullbacks and reversals. The indicator uses pure price action, which makes it possible to get rid of lagging indicators. Be independent of the values and stage of the market.
Get educational swing trading ideas for the Micro Emini S&P 500 and Micro Emini Nasdaq futures. These are real-time swing trading ideas that are posted to a private Telegram group for all users to read. Dynamic risk and position management are also included.
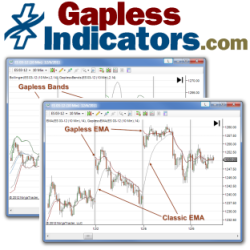
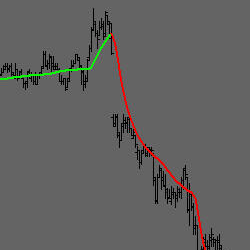
Never worry how an opening price jump or drop affects your favorite classic indicator (MACD, Stochastics, EMA, ATR, etc.). Gapless Indicators are enhanced versions of 15 classic technical indicators that self-adjust in real-time to any opening gap (aka overnight gap).
Unlock the secrets to market mastery with this 100% free indicator combo. Designed to sharpen your trading and boost your consistency – all with zero cost. Benefit from this comprehensive training and achieve reliable results swiftly. No repaints, just unwavering accuracy!
PLA Dynamical GOLD is a complex moving average that has 101 different speeds per length, overshoot true or false input, anti-reverse true or false input, and anti-reverse percentage adjustment. Also included is a fast start algorithm which requires only 10 bars of data to compute an output value.
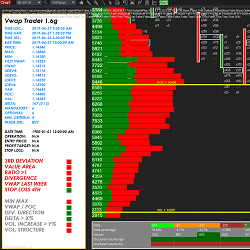
itcVwapTrader is a strategy for NinjaTrader 8 which is based on the mean reversion and the use of orderflow (vwap, footprint, market profile) for precise entries. This strategy uses more than 14 criteria for decision making. The strategy is highly customizable and comes in 3 versions.
December 2, 2024
Mastering Sideways Markets With Auction Bars and Range Projections
November 19, 2024
Enhancing Your Automated Trading System: Key Insights from Best Pro Trade
November 14, 2024
NinjaTrader New Ecosystem Tools: October 2024 Edition
Enter Email for Updates