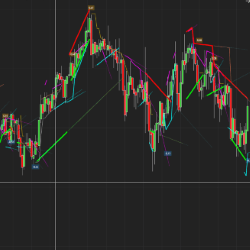
Trendlines can be drawn in so many incorrect ways. Drawing it incorrectly can make most trades losers and vice versa. Getting it right makes all the difference! QTL has a faster and far more accurate approach. Ready to automatically find the most accurate trendlines?
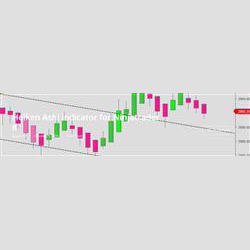
Much more than just a great looking set of Heiken Ashi bars! Integrated supply and demand levels, voice alerts, picture-in-picture mode, bar speed monitoring as well as volume and trend analysis. Super clean and fast with lots of options. API for the zones and algo bias. Free trial available.
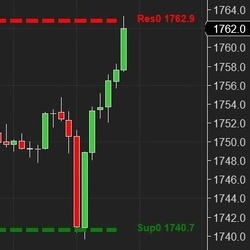
Based on an Artificial Intelligence (AI) engine, the E.G. Trigger Point calculates support and resistance (S&R) lines. The S&R are specific price points on a chart expected to attract the maximum amount of either buying or selling.
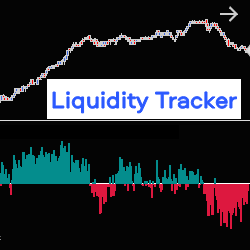
The Liquidity Tracker allows you to monitor, in real time, liquidity variations in the Order Book (pending orders at Bid & Ask), on one or two correlated instruments, at the same time. It therefore allows you to follow the evolution of the market based on the strength of supply or demand.
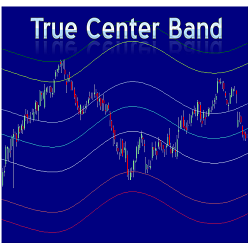
The True Center Band (TCB) indicator shows the trend, different levels of support and resistance and the boundary of price action. The TCB is designed to work on all intraday and daily charts as well as any market.
This incredibly innovative suite of Bollinger Bands and divergence indicators shows selected, plotted ‘dots’ with a broad selection of Bollinger Band combinations. You can choose from seven indicator combinations!
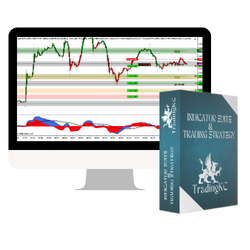
Simplify your trading with my strategy: trend, price action, support/resistance and momentum. Green/red bars indicate trend, custom ExCon indicator manages setups, pivots show support/resistance and MACD ties it all together. Clear entries, take profits and exits with simple rules for engagement.
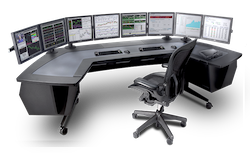
Immerse yourself in a dynamic trading environment with AmerTd's On-Site & Virtual Trading Rooms. Equipped with the latest technology and real-time market data, this state-of-the-art facility offers a collaborative space for traders to execute strategies and maximize their potential.
Master the market with this intelligent trailing indicator! Smart volume-based trailing algorithm identifies up and down trends. Perfectly suited to support “stop-and-reverse” as well as “always-in-the-market” trading styles. Discover the most consistent symbols with an instant performance graph!
Learn everything you need to know about charts and technical analysis to become consistent in the markets. This course includes basic structure, support/resistance, trend, supply/demand, Fibonacci, change control zones, divergence, trading psychology, and putting it all together.
December 2, 2024
Mastering Sideways Markets With Auction Bars and Range Projections
November 19, 2024
Enhancing Your Automated Trading System: Key Insights from Best Pro Trade
November 14, 2024
NinjaTrader New Ecosystem Tools: October 2024 Edition
Enter Email for Updates