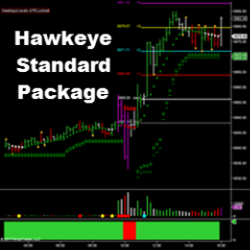
Hawkeye Standard Package is Hawkeye Traders' most popular indicators, providing trend and volume analysis across multiple markets. These powerful indicators tell traders when a trend is commencing, in congestion, and where to find the correct exit. Buy now using code: “NT10Off” for a 10% discount!
Learn a battle-tested strategy for trading the markets in under 60 mins per day. Here’s just a fraction of what you’ll learn: How professional traders find good trades, how to read the markets and a market that has unique advantages over others.
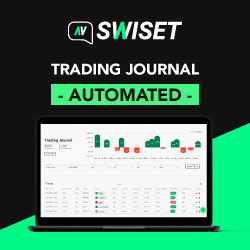
Quickly identify your best trading metrics on a 100% cloud-based journal. Starting from 0 USD, keep your track record automated with Swiset. Register now!
Peaks is a powerful market indicator meticulously designed to identify precise tops and bottoms of price movements. Using sophisticated analysis techniques it pinpoints potential reversal points in the market. Peaks empowers traders to optimize entries & exits, making trading decisions confidently.
The Lighthouse Trading strategy works fully automatically in the futures market. Besides trading in different markets simultaneously, you can configure it in distinct ways in each one of them. The algorithm analyses time and sales, volume, rhythm and acceleration in real time.
The E-widget is a suite of tools like a Swiss Army knife, offering customizable analytical solutions for traders. Use E-mini Wizard preset templates for Fibonacci levels, support & resistance, risk:reward ideas, regression trades, or build your own. E-widget is designed to work on all markets.
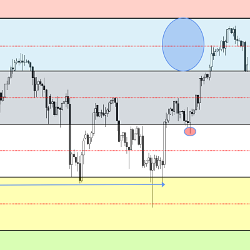
The iMTF® Ichimoku indicator features multi time frame support/resistance levels using crosses (long term) and purple dots (short term). Cloud breakouts are represented by green and red shaded areas to identify buy and short sale zones after an instrument has broken out of the cloud.
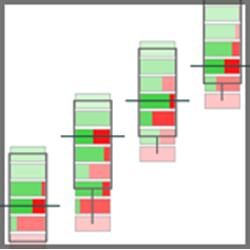
LogikBarProfiler is a feature-rich bar volume / tick / price distribution heads-up display analysis tool. It displays data computed within each bar, as well as buyer v. seller distribution at price levels. This combines the usefulness of POC, delta, and activity analysis into one intuitive tool.
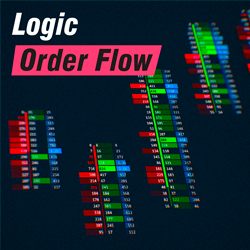
Logic order flow features unique and easy-to-use graphical options, one-click presets and configurations, a profile, footer, and databox for a complete market analysis. It guarantees the best visualization of patterns and zones, making this tool one of the best options on the market.
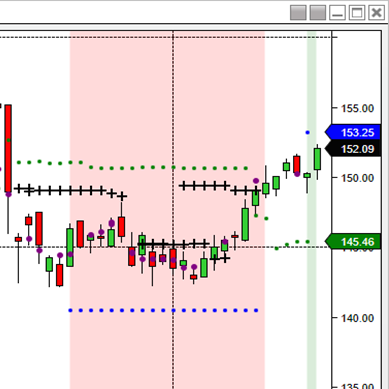
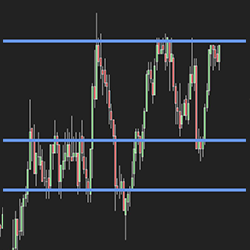
Support/Resistance Levels can be tedious to look for. You have to go back on your chart (with a changing Y axis), and it can be hard to spot every significant point of contact. Tyche Trading’s Automatic S/R Indicator eliminates that with a high level of precision. Get a seven-day free trial today!
December 2, 2024
Mastering Sideways Markets With Auction Bars and Range Projections
November 19, 2024
Enhancing Your Automated Trading System: Key Insights from Best Pro Trade
November 14, 2024
NinjaTrader New Ecosystem Tools: October 2024 Edition
Enter Email for Updates