This is the "heads-up display" indicator that has made The Intentional Trader famous since 2009. It will tell you when the “Smart Money” market makers are likely to be manipulating price. If you know that, then you can evaluate what may happen next - a huge edge in day trading!
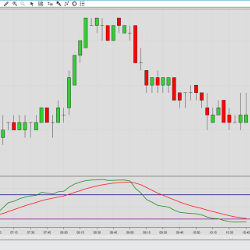
The Slow Relative Strength Index is an adaptation of the classic RSI calculation, customized for use in higher timeframes. The slow RSI calculation compares the close price with an exponential moving average instead of the previous value.
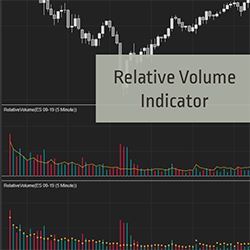
Detect unusual or below average volume easily. Identify the start or end of a move with no effort. Relative Volume (RVOL) compares current volume to the average volume for the same time of day. Start your 2-week trial now!
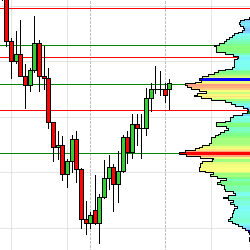
GomMPPro is a high-performance tick-based volume profiler. It offers many data points such as: HVN/LVN, POC, VWAP & VA. Additionally, it features customizable hotkeys allowing traders to quickly toggle between favorite settings. Free 2-week trial available.
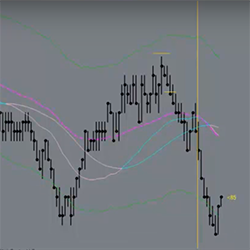
FREE indicators and workspaces to follow along with Horst's YouTube tutorials and videos. Check out live daily YouTube trades on the website & discover the ability to see upcoming moves clearly & logically before they happen. Download the free workspaces & indicators today!
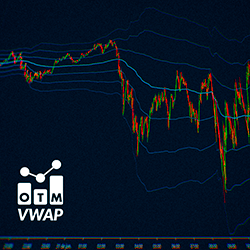
OTM VWAP, the "Volume Weighted Average Price," acts as a moving average based on trading volume. It includes the central VWAP, which serves as support or resistance depending on the price position and its deviations. With this indicator you can set VWAP per session, weekly and monthly.
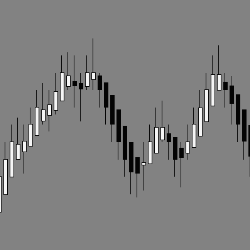
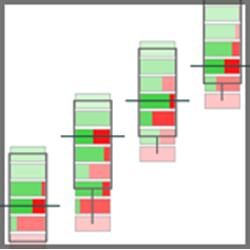
EPyFBarsType is a tick-based bar, unlike time-based bars such as regular Japanese candles. These bars are one of the main components of our system, due to the objectivity they provide for technical analysis. This bar type helps in identifying market moves and avoiding choppy areas.
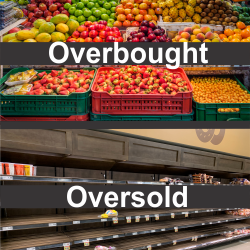
No subchart indicators or additional time frame charts are required to see when price becomes overbought or oversold. This helps the trader identify weakness in an uptrend or strength in a downtrend to anticipate a potential change in price direction. An award winning "heads-up display" indicator!
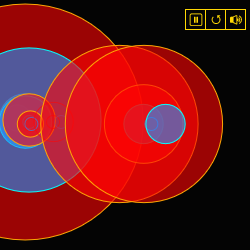
Hear, see and feel the market! A multi-sensory, audio-visual experience of reconstructed trades being executed at every moment. It uses high-performance audio processing technology and an uncluttered visual representation of each trade to give a sense of the pace and size hitting the tape.
LogikBarProfiler is a feature-rich bar volume / tick / price distribution heads-up display analysis tool. It displays data computed within each bar, as well as buyer v. seller distribution at price levels. This combines the usefulness of POC, delta, and activity analysis into one intuitive tool.
December 2, 2024
Mastering Sideways Markets With Auction Bars and Range Projections
November 19, 2024
Enhancing Your Automated Trading System: Key Insights from Best Pro Trade
November 14, 2024
NinjaTrader New Ecosystem Tools: October 2024 Edition
Enter Email for Updates