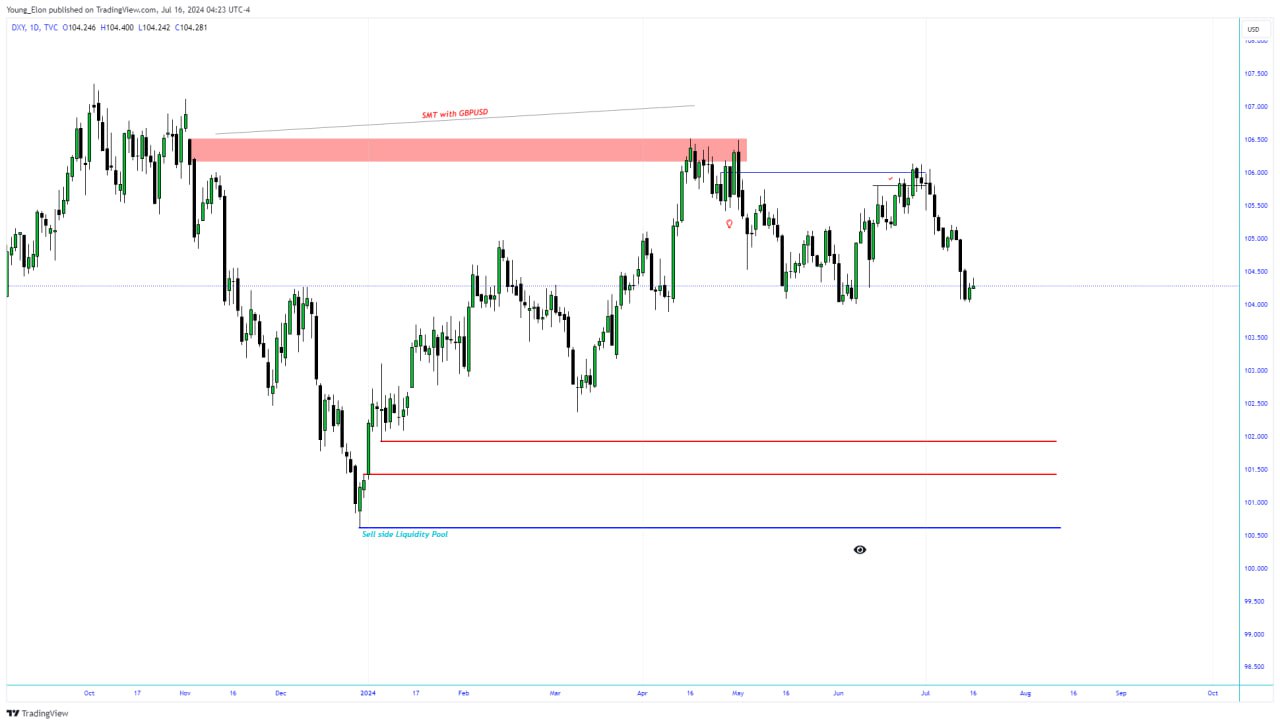
This is a YouTube channel, in which they share the precise models for smart money trading concepts. With the concepts, you can trade like the banks, by following their foot prints. With the models, you are able to see the specific footprints and in return trade like the institutions.
Grab this FREE 10-page guide today! Discover little-known chart settings that will have a huge impact on your trading consistency.
The algorithm allows for fully automatic trading or semi-automatic. It works in Micro or Micro futures markets. For the algorithm to manage the trades, you can set a stop-loss and target from the configuration menu. If you want, you can also choose NinjaTrader’s ATM Strategy.
The HolyGrail Algo uses calculations of the Hull Exponential Moving Average to identify market direction. A long or short condition is printed on the chart showing the potential direction an instrument may move. HolyGrail mainly uses it for indices, but it works with any market and any timeframe.
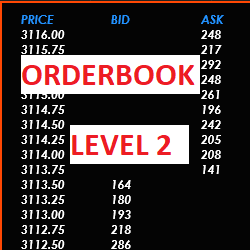
itcOrderBook is a Ninja Trader 8 indicator that displays the order book for the current asset (market depth or level 2). Ask & Bid are displayed on the price ladder and colors & text size can be customized at will. Users can set the location X,Y where the box will display.
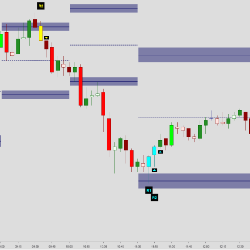
The Auction Bars indicator identifies higher time-frame ranges, displayed as Auction Ranges. These ranges show the current market value area of the ongoing auction. The accompanying congestion zones work as support / resistance where spike and reversal patterns frequently plot.
Quintalytics develops custom trading software for retail and institutional traders, brokers and other industry professionals for both NinjaTrader 7 and NinjaTrader 8. We have utilized and developed hundreds of custom indicators and trading strategies over 20 years. We can also modify and optimize.
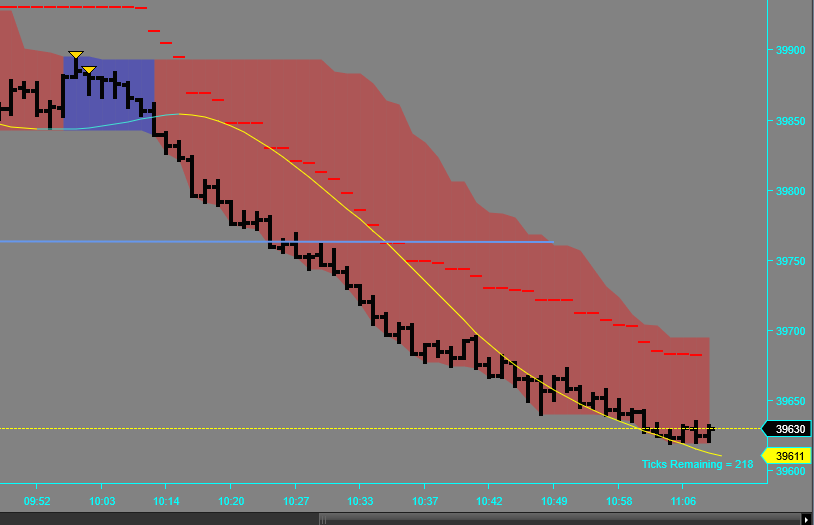
Shot Caller is a time- and volume-driven indicator, utilizing eight different data points to help identify potential short term trends in the market. Once engaged, the channel will be highlighted BLUE or RED and provide signal triangles to aid in the decision making process.
The True Center Band (TCB) indicator shows the trend, different levels of support and resistance and the boundary of price action. The TCB is designed to work on all intraday and daily charts as well as any market.
The SuperDOM Average Price Column shows a position average price accumulated since the first order execution. All opened and closed executions from the beginning of the position are used for the calculation. Save time by knowing your current position's average price for all of your past entries!
December 2, 2024
Mastering Sideways Markets With Auction Bars and Range Projections
November 19, 2024
Enhancing Your Automated Trading System: Key Insights from Best Pro Trade
November 14, 2024
NinjaTrader New Ecosystem Tools: October 2024 Edition
Enter Email for Updates