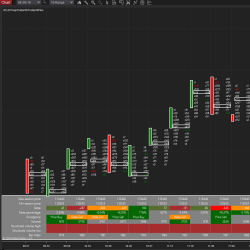
itcFootprint is an indicator for Order Flow and footprint. It displays data from the tape as footprint bars and also provides a statistic panel with powerful tools like delta analysis, divergence, volume structure, and unfinished business (bar by bar).
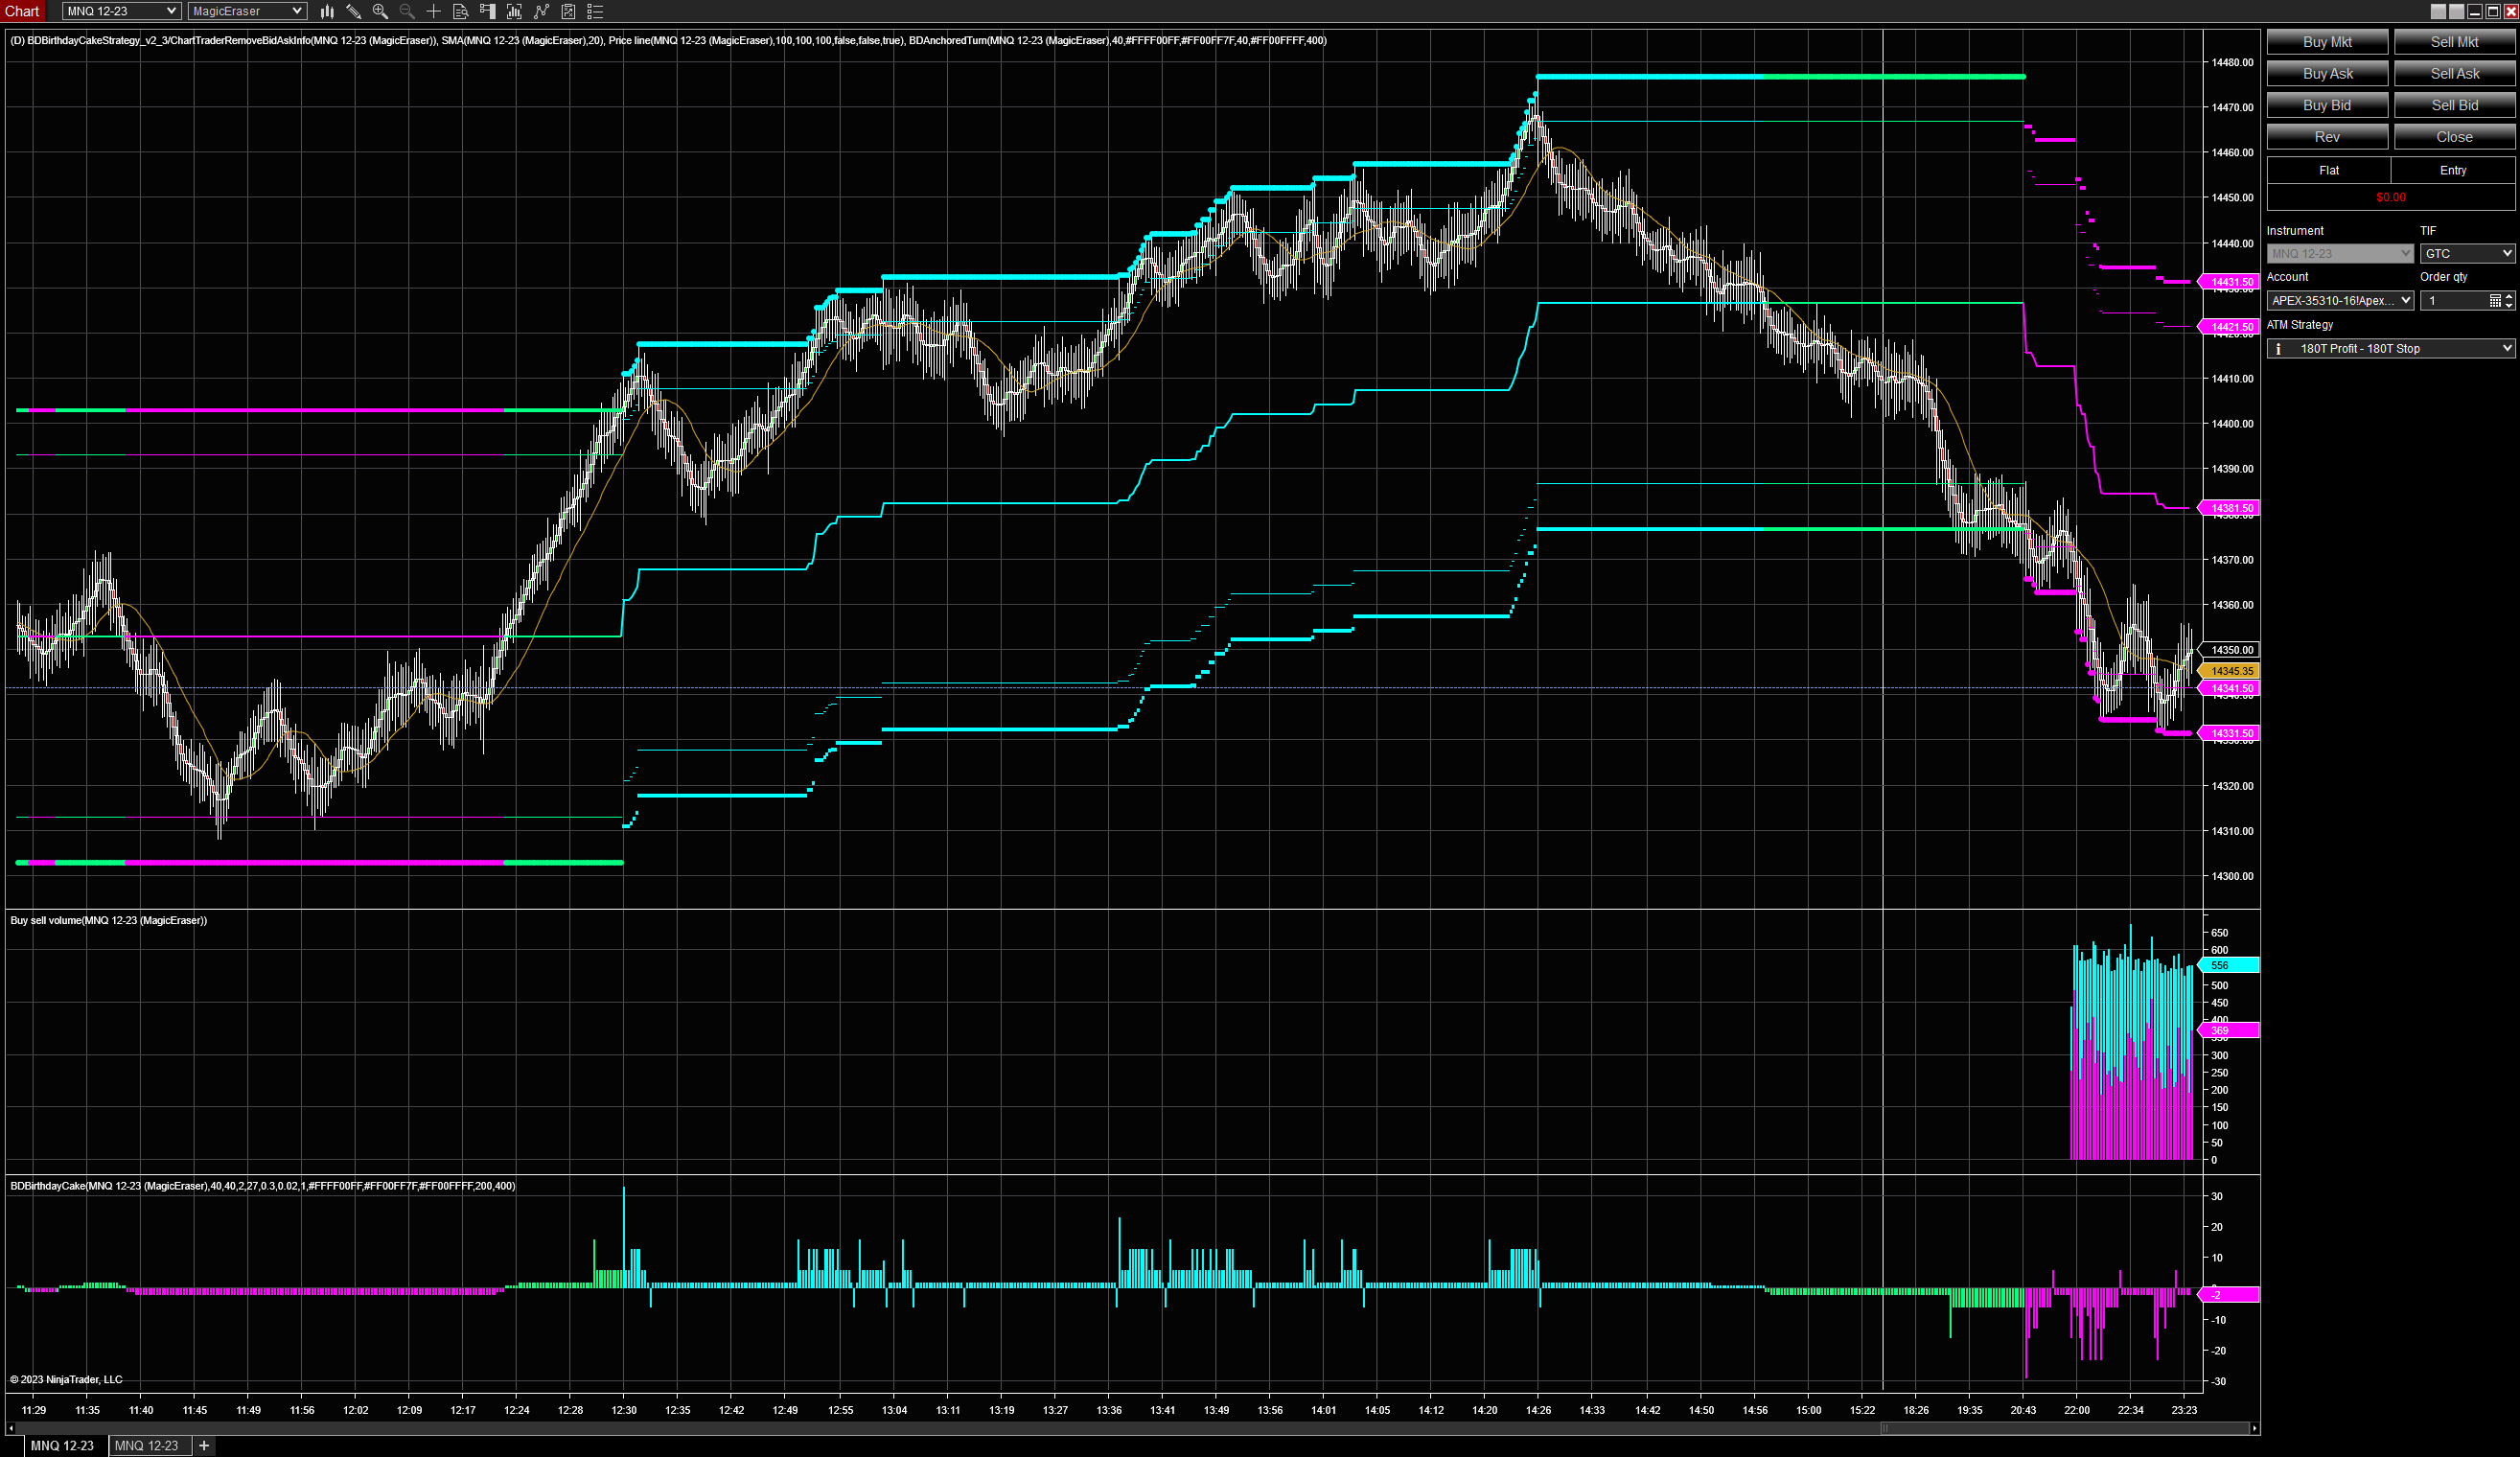
This anchored turn indicator makes it easier to identify the current trend for intraday trading, and provides multiple areas for precise entries. They use it internally for all of their trend based strategies and have been working on new scalping strategies, as well.
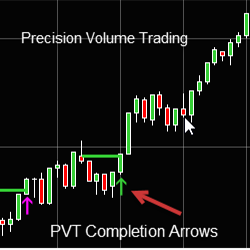
Precision Volume Trading Completions Arrows helps traders determine if the market will move up or down.
IAStealth signals the entry when the shorter time frame momentum has reversed back in the direction of the trend. More important is to know when the longer time frame momentum is showing signs of reversing. IAStealth alerts the shorter time frame after IAMomentum/IATrend alert the longer time frame.
Trading requires edge, but in the new world of machine and algorithmic trading disrupting information processing and decision making, it’s incredibly elusive. Boss Trading addresses this problem by introducing professional experience and trader role modelling via live trading masterclasses.
Market Analyzer Column: Effortlessly tailor real-time market data to your needs.
Fear and anxiety are common trading emotions. They can turn an otherwise profitable strategy into one that is constantly losing. The goal of Traderistic is to put an end to this frustration by monitoring the body and raising awareness of stress so that one can begin trading to their full potential.
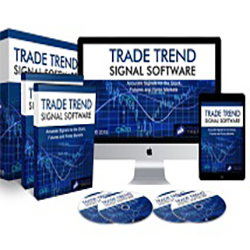
TradeTrend© provides entry & exit signals including trailing stop levels for stocks, futures and forex. This automated strategy can be used to make more informed and confident decisions for a wide range of options strategies and helps traders stay on the right side of the market & momentum.
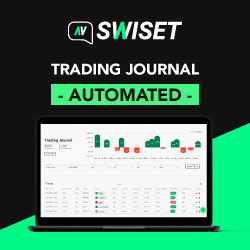
Quickly identify your best trading metrics on a 100% cloud-based journal. Starting from 0 USD, keep your track record automated with Swiset. Register now!
Get educational swing trading ideas for the Micro Emini S&P 500 and Micro Emini Nasdaq futures. These are real-time swing trading ideas that are posted to a private Telegram group for all users to read. Dynamic risk and position management are also included.
December 2, 2024
Mastering Sideways Markets With Auction Bars and Range Projections
November 19, 2024
Enhancing Your Automated Trading System: Key Insights from Best Pro Trade
November 14, 2024
NinjaTrader New Ecosystem Tools: October 2024 Edition
Enter Email for Updates