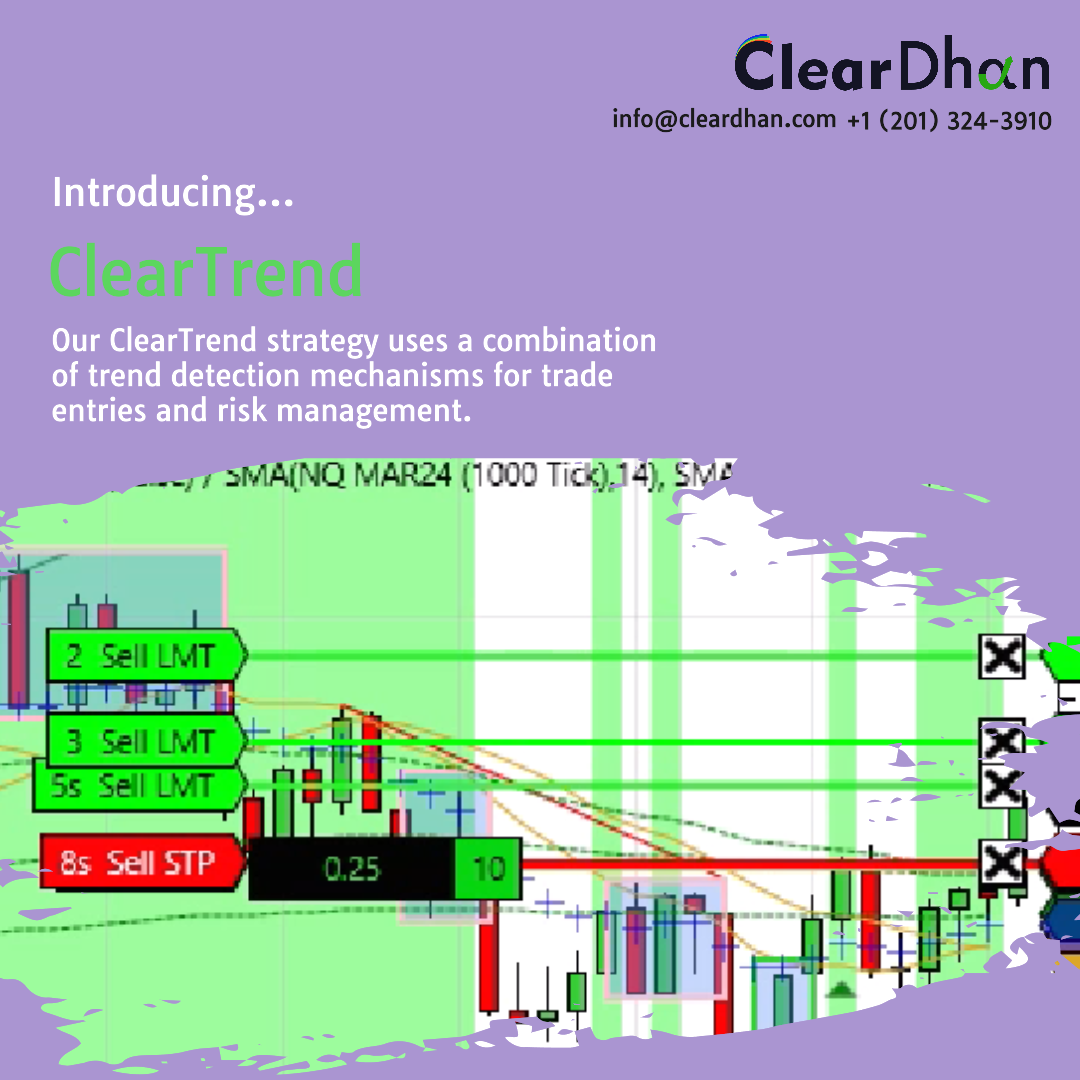
ClearTrend uses a combination of trend detection mechanisms for trade entries and risk management. Works to identify optimal trades using real-time time responsiveness to opportunities using trend strength. Available as a fully automated strategy or as an indicator form. Five-day free trial.
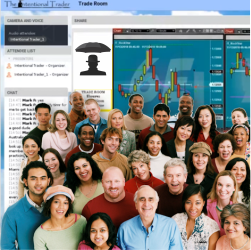
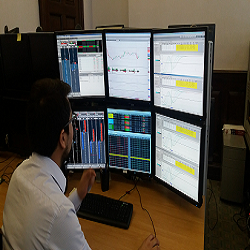
Day trading six futures instruments every day from 9am until 12pm Eastern time. Watch the Intentional Trader system in action in real time. Listen to a trade room moderator call out trades before entering them. They have been trading the same system and indicators since 2009!
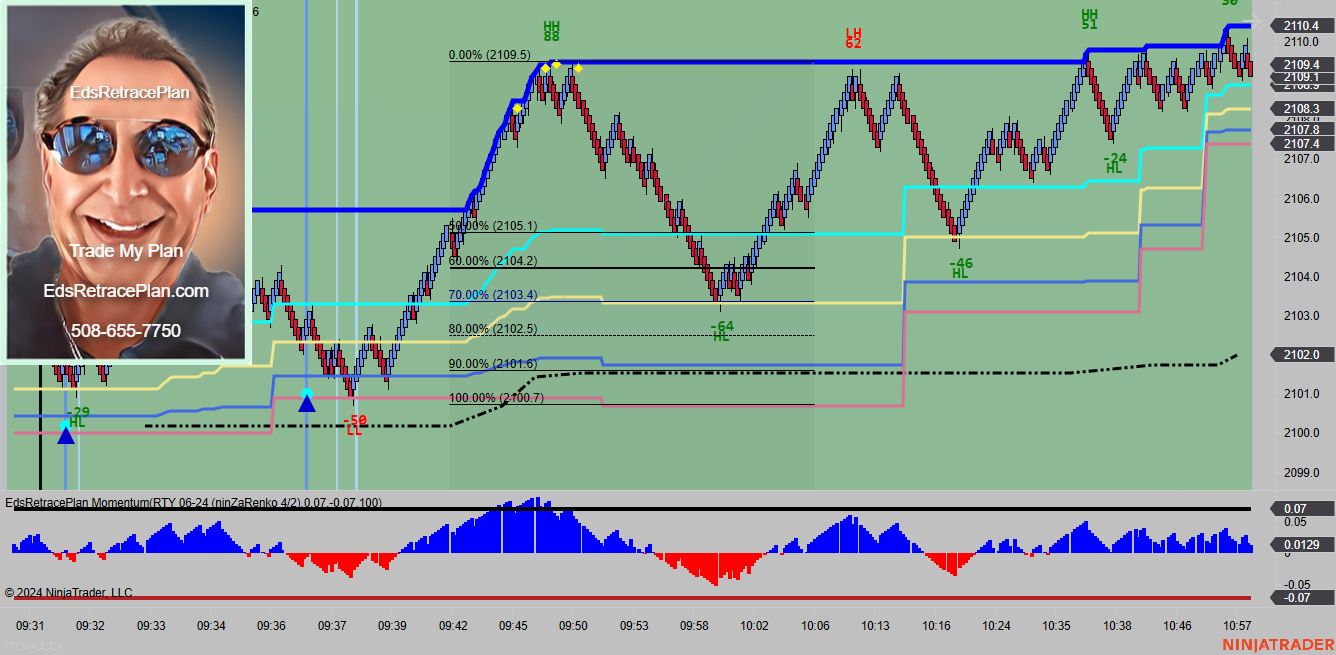
EdsRetracePlan Momentum Reversal Indicator is for day trading ES, YM, RTY, NQ, CL and GC. The indicator identifies reversal trades by finding and marking tops and bottoms. These trades signal the end of a move and opportunities to get short at the highs and long at the lows.
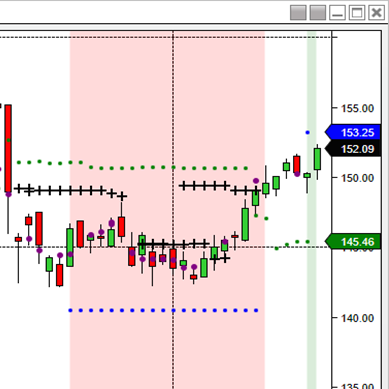
The iMTF® Ichimoku indicator features multi time frame support/resistance levels using crosses (long term) and purple dots (short term). Cloud breakouts are represented by green and red shaded areas to identify buy and short sale zones after an instrument has broken out of the cloud.
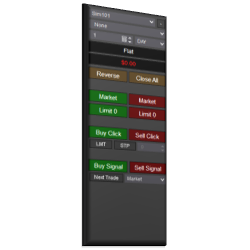
The Signal Entry Orders indicator allows traders to click a button that initiates logic to submit orders immediately on the close of a bar, as soon as a signal occurs. This removes unnecessary stress and challenge on entering orders.
Free daily newsletter - global news & views; free weekly YouTube (Sunday) to prepare you for the week ahead; 1-day workshops; 1-week courses zero to hero; accredited masterclass financial & commodity trading; flexi-masterclass, which includes a free trading challenge; and trader mentoring.
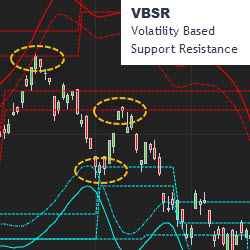
MetaSwing plots the hidden structure of support and resistance in real-time. VBSR (volatility based support resistance) makes this visible in advance, in all timeframes. Markets are non-linear and your tools should be as well. It’s not your father’s TA. Trial MetaSwing.
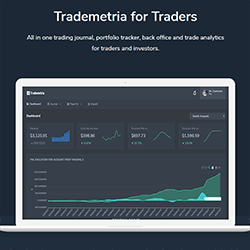
This all-in-one trading journal, portfolio tracker and trade analyzer software helps traders and investors make better trading decisions based on statistical evidence. Better trading starts with better data.
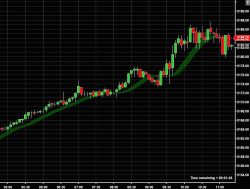
Is it a trend or a movement? Trend Ribbon uses one color to indicate an uptrend and another to indicate a downtrend. The ribbon shows trend strength and the transition of direction when the ribbon narrows and “flips.” Fully adjustable to your style and timeframe: day, swing or longer trading.
With decades experience as an active trader & accredited coach, Mandi understands what it takes to build a successful trading career. She specializes in coaching HedgeFund, Prop, Bank & Private Traders around the globe in the essential mindset aspects of trading.
December 2, 2024
Mastering Sideways Markets With Auction Bars and Range Projections
November 19, 2024
Enhancing Your Automated Trading System: Key Insights from Best Pro Trade
November 14, 2024
NinjaTrader New Ecosystem Tools: October 2024 Edition
Enter Email for Updates