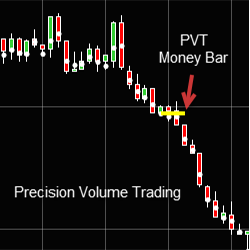
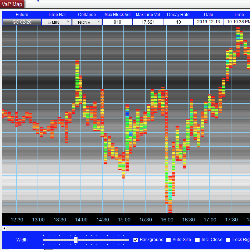
Precision Volume Trading Money Bar lets the trader know if it is half of the current move or the market is reversing.
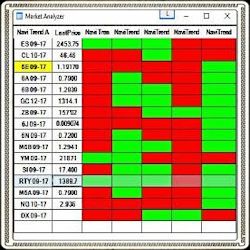
Utilizing pre-built indicators, the TrendFinder shows the probability of a market trend and price action continuation or termination, in real time. This Market Analyzer enhancement examines corresponding, short or long term and beginning or ending market trends with ease. Learn how!
Take advantage of IndicatorSmart’s special discounts for NinjaTrader Ecosystem users. Be sure to sign up for their Members List on their site for even more special offers and to stay informed about important trader events.
AiWave is a cutting-edge Artificial Intelligence powered tool that provides real-time market reversal forecasting. It empowers traders with valuable insights into market movements, enabling them to make more informed decisions and potentially improve their trading outcomes.
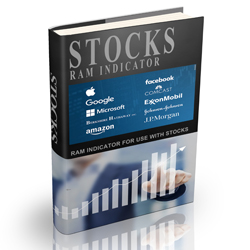
PriceIsKing.com's Stocks RAM Indicator is a powerful tool based on years of research and testing that shows equities traders entry points with arrows when the right condition is met. Get started with a free 2-week trial today!
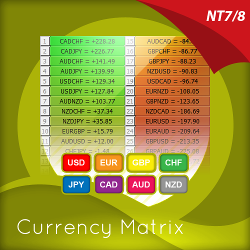
The currency matrix indicator is a simple solution to a complex problem, revealing sentiment for the currency across the currency complex. Now traders can know when they're trading with the universal flow, not against it. Learn more about this unique Forex indicator for NinjaTrader!
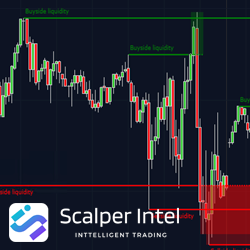
Unlock your trading strategy's potential with the Buyside & Sellside Liquidity Indicator. Gain deep insights into liquidity dynamics in ICT Trading methodology. Key features include Buyside and Sellside liquidity levels, revealing support and resistance zones, and Liquidity Voids.
Take trendline trading to a new level with the TrendlineProTrader, developed with your favorite trendline tactics including: horizontal, diagonal, channel OCO, and breakout-pullback. It includes automated trade management and traders can use their own indicators. See TrendlineProTrader in action!
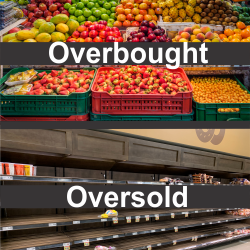
No subchart indicators or additional time frame charts are required to see when price becomes overbought or oversold. This helps the trader identify weakness in an uptrend or strength in a downtrend to anticipate a potential change in price direction. An award winning "heads-up display" indicator!
Visualize the market like never before. The VAPMap (Volume At Price Map) displays the total volume traded at each price and time, using a color spectrum from red (lowest) to blue (highest). The background lines show the total historical traded volume for every price level. Click for a free trial.
December 2, 2024
Mastering Sideways Markets With Auction Bars and Range Projections
November 19, 2024
Enhancing Your Automated Trading System: Key Insights from Best Pro Trade
November 14, 2024
NinjaTrader New Ecosystem Tools: October 2024 Edition
Enter Email for Updates