Are you busy but want to be consistent in the market? Do you want a strategy with fixed rules? Here, you get an automatic robot including an indicator and complete strategy, plus access to an internal Discord channel. Get started with a one-week free trial today over zoom, no installation needed!
L’orderflow trading è lo studio dei volumi nel tempo e nello spazio sia nel book che nel volume profile. Individuare le zone di prezzo con maggior volume di scambio sul book e nel tempo. Studiare la dinamicità dei volumi sul book. Come usare il WVAP. Come usare il Cumulative Delta.
No need to stare at the chart and wonder or make guesses - the Raptor will tell you! The Raptor detects potential trades for you out of the box and will alert you when these trades are setting up. This gives you plenty of time to get into the market with zero stress.
The Jurik Volatility Bands can be used for entries for trends by using the zero line crosses whilst counter-trend trades can be made once the oscillator line is close to the outer bands. It works in range-bound and trending markets.
Are you tired of only being able to trade futures manually? We have a fully Otter-mated strategy, so you can make trades while you sleep or do the things you enjoy! Try it now with our special introductory period for your first three months.
Channel levels are defined based on high and low prices influenced by candlestick bodies. These points are calculated based on the defined channel levels and look back periods. Delta values are computed to determine the channel's upward or downward slope.
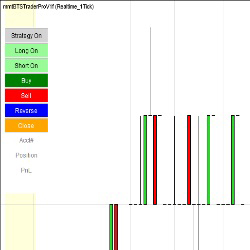
The ATPMMT is an automated strategy designed to assist traders with the ever-difficult emotions of entering and staying with the trade. ATPMMT searches for potential entries throughout the trading session.
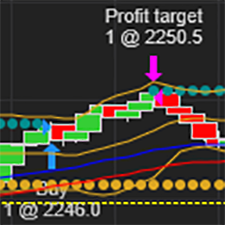
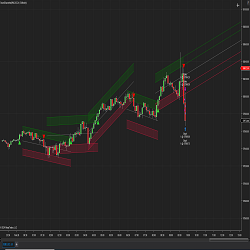
The Buy/Sell Zones are an adaptive approach to expansion and contraction within market rotations. Each rotation provides an area of interest for either the bid or offer, where they need to engage in order to protect the possibility of further extension. This approach allows you to trade with trend.
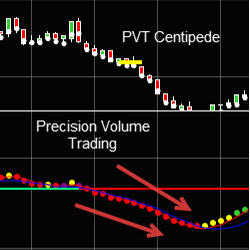
Precision Volume Trading Centipede is an indicator that works with all of our PVT tools including a moving average showing divergence.
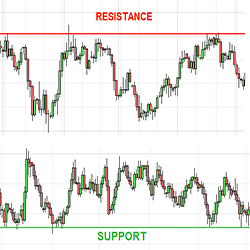
Plots chart and/or synthetic support and resistance lines from a higher time frame.
December 2, 2024
Mastering Sideways Markets With Auction Bars and Range Projections
November 19, 2024
Enhancing Your Automated Trading System: Key Insights from Best Pro Trade
November 14, 2024
NinjaTrader New Ecosystem Tools: October 2024 Edition
Enter Email for Updates

 from Indicator Warehouse.png)