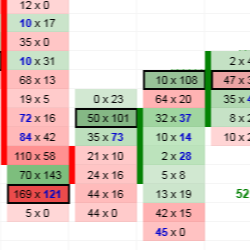
TD Order Flow features Heavy Volume Zones, multiple Volume Nodes, Imbalances, Unfinished Business, a built-in Trades Filter and a separate Cumulative Delta indicator as a bonus. It works with both futures and forex and includes 12 hours of Order Flow video training.
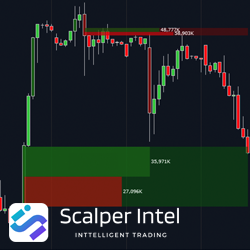
The Fair Value Gap (FVG) from ScalperIntel is an indicator that identifies inefficiencies (or imbalances) in the market and then marks the upper and lower limits of the gaps. The Bull and Bear FVG’s are plotted along with the bull/bear volume profile from the gap start.
Our Custom Programming service is ideal for small and short-term projects. We believe programmers should be allies to trading, not a money drain. We only accept payment if you are satisfied with our work. We charge a very reasonable $15 USD per hour rate.
Whether you are an absolute beginner, or an advanced trader, this course if for you. The Professional Trading Course is a comprehensive training program or serious traders consisting of 22 video lessons, a robust trading system plus ongoing support.
3 indicators in 1! The C-Dash is a customizable, check-list style dashboard that comes with The Chompsky Bands Pro and Chompsky Fibs. Includes current ATR Current BPMs (bars per minute), an algorithmically weighted color wheel (weighting is customizable), and more.
The ability to change colors of a line based on preset angles is revolutionary! Select any up/down trigger angle, any up/down release angle, and receive color changes and alert sounds. Lines stay a triggered color until the release angle is reached. The line then reverts to neutral.
Trading OrderFlow provides expert service in converting NinjaTrader 7 scripts to NinjaTrader 8. Enhance your NinjaTrader add-ons with NinjaTrader 8's multi-threading capabilities. Contact them to learn how they can convert your add-ons to the latest version of NinjaTrader!
TradeDevils Indicators offers unique indicators for NinjaTrader 8. Regardless of whether you are a scalper, a trend follower or a breakout trader, they can provide you with the right indicators to assist with your trading.
We provide programming services for NinjaTrader customers including indicators, addons, strategies and more.
Empower your trades with precision. Set your daily support and resistance levels, and this bot executes and manages your trades, seamlessly. Trading made simple. Start your free trial today.
December 2, 2024
Mastering Sideways Markets With Auction Bars and Range Projections
November 19, 2024
Enhancing Your Automated Trading System: Key Insights from Best Pro Trade
November 14, 2024
NinjaTrader New Ecosystem Tools: October 2024 Edition
Enter Email for Updates