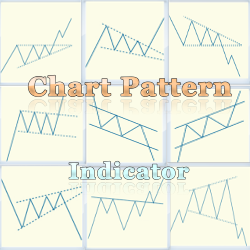
The Chart Pattern Indicator Package includes a number of pattern recognition indicators such as pennant, flag, wedge, triangle and more. The indicators can be purchased separately or discounted as a suite. Learn more!
MBoxWave Wyckoff Trading System is an order flow trading system using bid/offer and momentum to identify supply/demand imbalances. The system contains a series of indicators and signals designed to be used together to identify high probability trading opportunities, inspired by Wyckoff methodology.
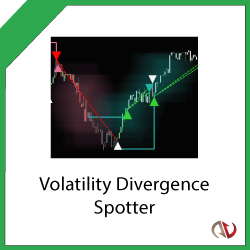
Spot the calm before the storm for both breakouts and breakdowns with this ultimate volatility indicator! Spot bullish accumulation and consolidation points before strong upward breakouts and continued bullish trends. Find points of failing strength at plateaus and tops before drops.
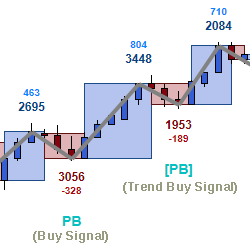
Download a 14-day test period of this trading indicator that identifies points to enter the market for price pullbacks and reversals. The indicator uses pure price action, which makes it possible to get rid of lagging indicators. Be independent of the values and stage of the market.
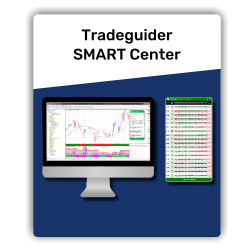
Unlock the power of Wyckoff VSA through an optimized package that uses SMART Technology to generate easy-to-use live alerts and preset approaches. Save 80% charting time with SMART Technology. Four easy-to-implement, rules-based strategies. SMART audible notifications for signals and setups.
With no coding required, StratGen allows the everyday trader to generate strategies. In a couple of clicks, traders can generate strategies with over +1,000 signals at their fingertips. Generate strategies using indicators, price action, time of day, alternate exits and much more.
Momentum indicators work best when indicating an overbought or oversold condition within a trend. Expect a reversal back in the direction of the trend when IAMomentum reaches an extreme level while IATrend is alerting followers of that trend. Together, these two indicators highlight price reversals.
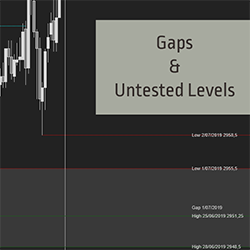
The Gaps & Untested Levels indicator tracks price gaps based on the prior session range or the prior session close. It can also track untested high of session, low of session, and open & close. Notice weak highs/lows immediately and be prepared for every gap fill trade. Start your 2-week trial now!
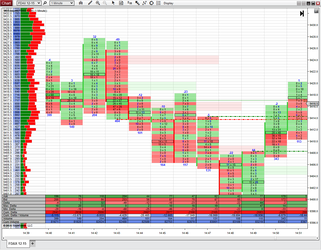
Pure and simple footprint (aka market profile or order flow chart) and volume profile chart add-on for NinjaTrader. Displays bid and ask volume traded at each price at each bar. Alternative charts – range, volume and tick charts - are also fully supported.
You can download and try our best free indicators for NinjaTrader 8 now! These indicators are free for life. 24-hour technical support. Watch video tutorials on indicator details and how to use them. Hurry! Click here to download and use now!
December 2, 2024
Mastering Sideways Markets With Auction Bars and Range Projections
November 19, 2024
Enhancing Your Automated Trading System: Key Insights from Best Pro Trade
November 14, 2024
NinjaTrader New Ecosystem Tools: October 2024 Edition
Enter Email for Updates