Price Action Harvester™ scans all markets to find consistent price action patterns based on historical data. Know how price moved for any instrument on particular days, during particular time-frames. A powerful tool for day traders. Don't miss this indicator!
Know that you’re an amazing trader but finding the funds to get started is the one thing standing in your way? At UProfitTrader, we can help! Simply choose the size account you’d like, show us what you’ve got through our unique testing process, then start turning your passion into a profession.
The Session Delta Pivot monitors the aggressive auction participants within a given session. By mapping this type of activity, the user can gauge the potential location for initiative activity as well as develop an understanding of directional day types.
A catalog of tools for traders available through subscription plans, offering a comprehensive set of features for enhanced trading. Access strategies, indicators, and other solutions designed to help you trade more effectively in the market.
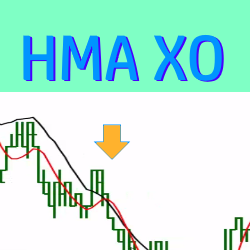
This trade setup indicator paints entry signals each time a Hull Moving Average (HMA) crossover occurs. The entry signals are customizable and can be filtered by the slope of the linear regression. Click here to watch a video and lean more!
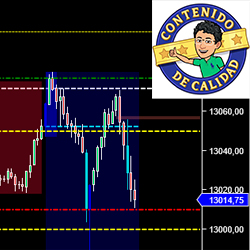
Análisis de mercados americanos una hora antes de la apertura: Futuros de Nasdaq (NQ y MNQ), S&P (ES y MES), Dow Jones (YM y MYM), Russell (RTY y M2K), Petróleo (CL y MCL) y Oro (GC y MGC). Determinación de niveles de compra y venta con Price Action y Smart Money.
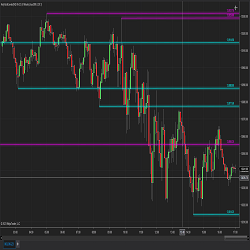
This algorithm calculates the support and resistance based on a look back period (number) of candles or bars and determines the support and resistance levels dynamically.
You know how important “to-the-tick” accuracy is, missing an entry by 1 tick or an exit by 1 tick can make All the difference in your P and L. Quaderr aims to find the Real Support and the Real resistance using volume profile. Every tick counts.
The Ichimoku Mentoring Program contains 4 weeks of pre-workshop webinars, a live 2-day boot camp, 2 months of post course mentoring, access to the trade room & Ichimoku research center. Learn more!
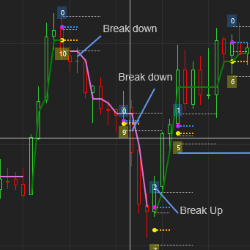
The indicator employs a proprietary algorithm, generating highly reliable signals in trending markets, leading to more confident trade decisions. The indicator's clouds move dynamically in tandem with market trends, offering a visually comfortable representation of market conditions.
December 2, 2024
Mastering Sideways Markets With Auction Bars and Range Projections
November 19, 2024
Enhancing Your Automated Trading System: Key Insights from Best Pro Trade
November 14, 2024
NinjaTrader New Ecosystem Tools: October 2024 Edition
Enter Email for Updates