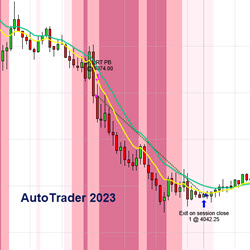
The AutoTrader 2023 system offers automated trading strategies, covering a broad range of trading risk profiles; indicators, backgrounds and a powerful money management module to protect profit and principal are also included. Lease includes training and support.
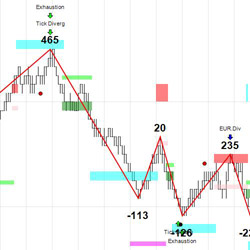
ZoneTraderPro features unique support and resistance zones to match known market trading patterns along with intuitive real time tools to identify trade entries and exits. Nothing ever disappears from a ZoneTraderPro chart so you can create and test trading strategies.
You can now calculate your recommended trade position size for stocks based on the current market volatility and your risk appetite, in real time. Once you input the “RiskPerTrade” amount, It displays the number of shares in your market analyzer column. Get this powerful risk management tool!
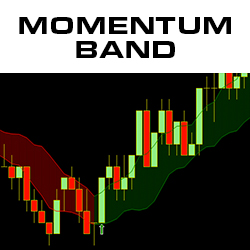
The Momentum Band indicator shows the trend and takes the noise out of the market, keeping you in trades longer, as you won’t get shaken out by temporary price fluctuations. Color changes and arrows indicate significant changes in momentum. Stay in Trades Longer & Download the Momentum Band Today!
Learn to flow with the market using a personalized and simplified strategy. This course includes a complete written and video curriculum with detailed homework reviews. One-on-one coaching and student-only groups to build confidence, consistency, clarity, connection and community.
Our Stock Trading Package includes pre-built workspaces, chart templates and Market Analyzers with scanners and alerts. Use ATS Chart Trader for trade management, ATS Inflection Point indicator for daily inflection points and use DTS Ichimoku Cloud Pattern for trade setups. Education is included!
E-Mini Tutor offers three 1 on 1 Day Trading Education options aimed at traders who are interested in understanding the markets. The Pivot based trading methodologies strive to forecast market moves before they occur empowering traders to work smart, not hard. Enroll today!
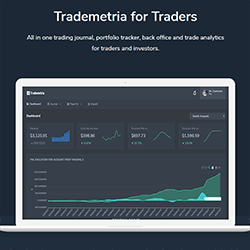
This all-in-one trading journal, portfolio tracker and trade analyzer software helps traders and investors make better trading decisions based on statistical evidence. Better trading starts with better data.
The Flow of fund(FOF) divergence signal indicator consists of the following parts: The Flow of fund histogram, FOF trend line, back test result in sub chart and divergence signal in main chart. The signal is instantly drawn on current bar and will not repaint.
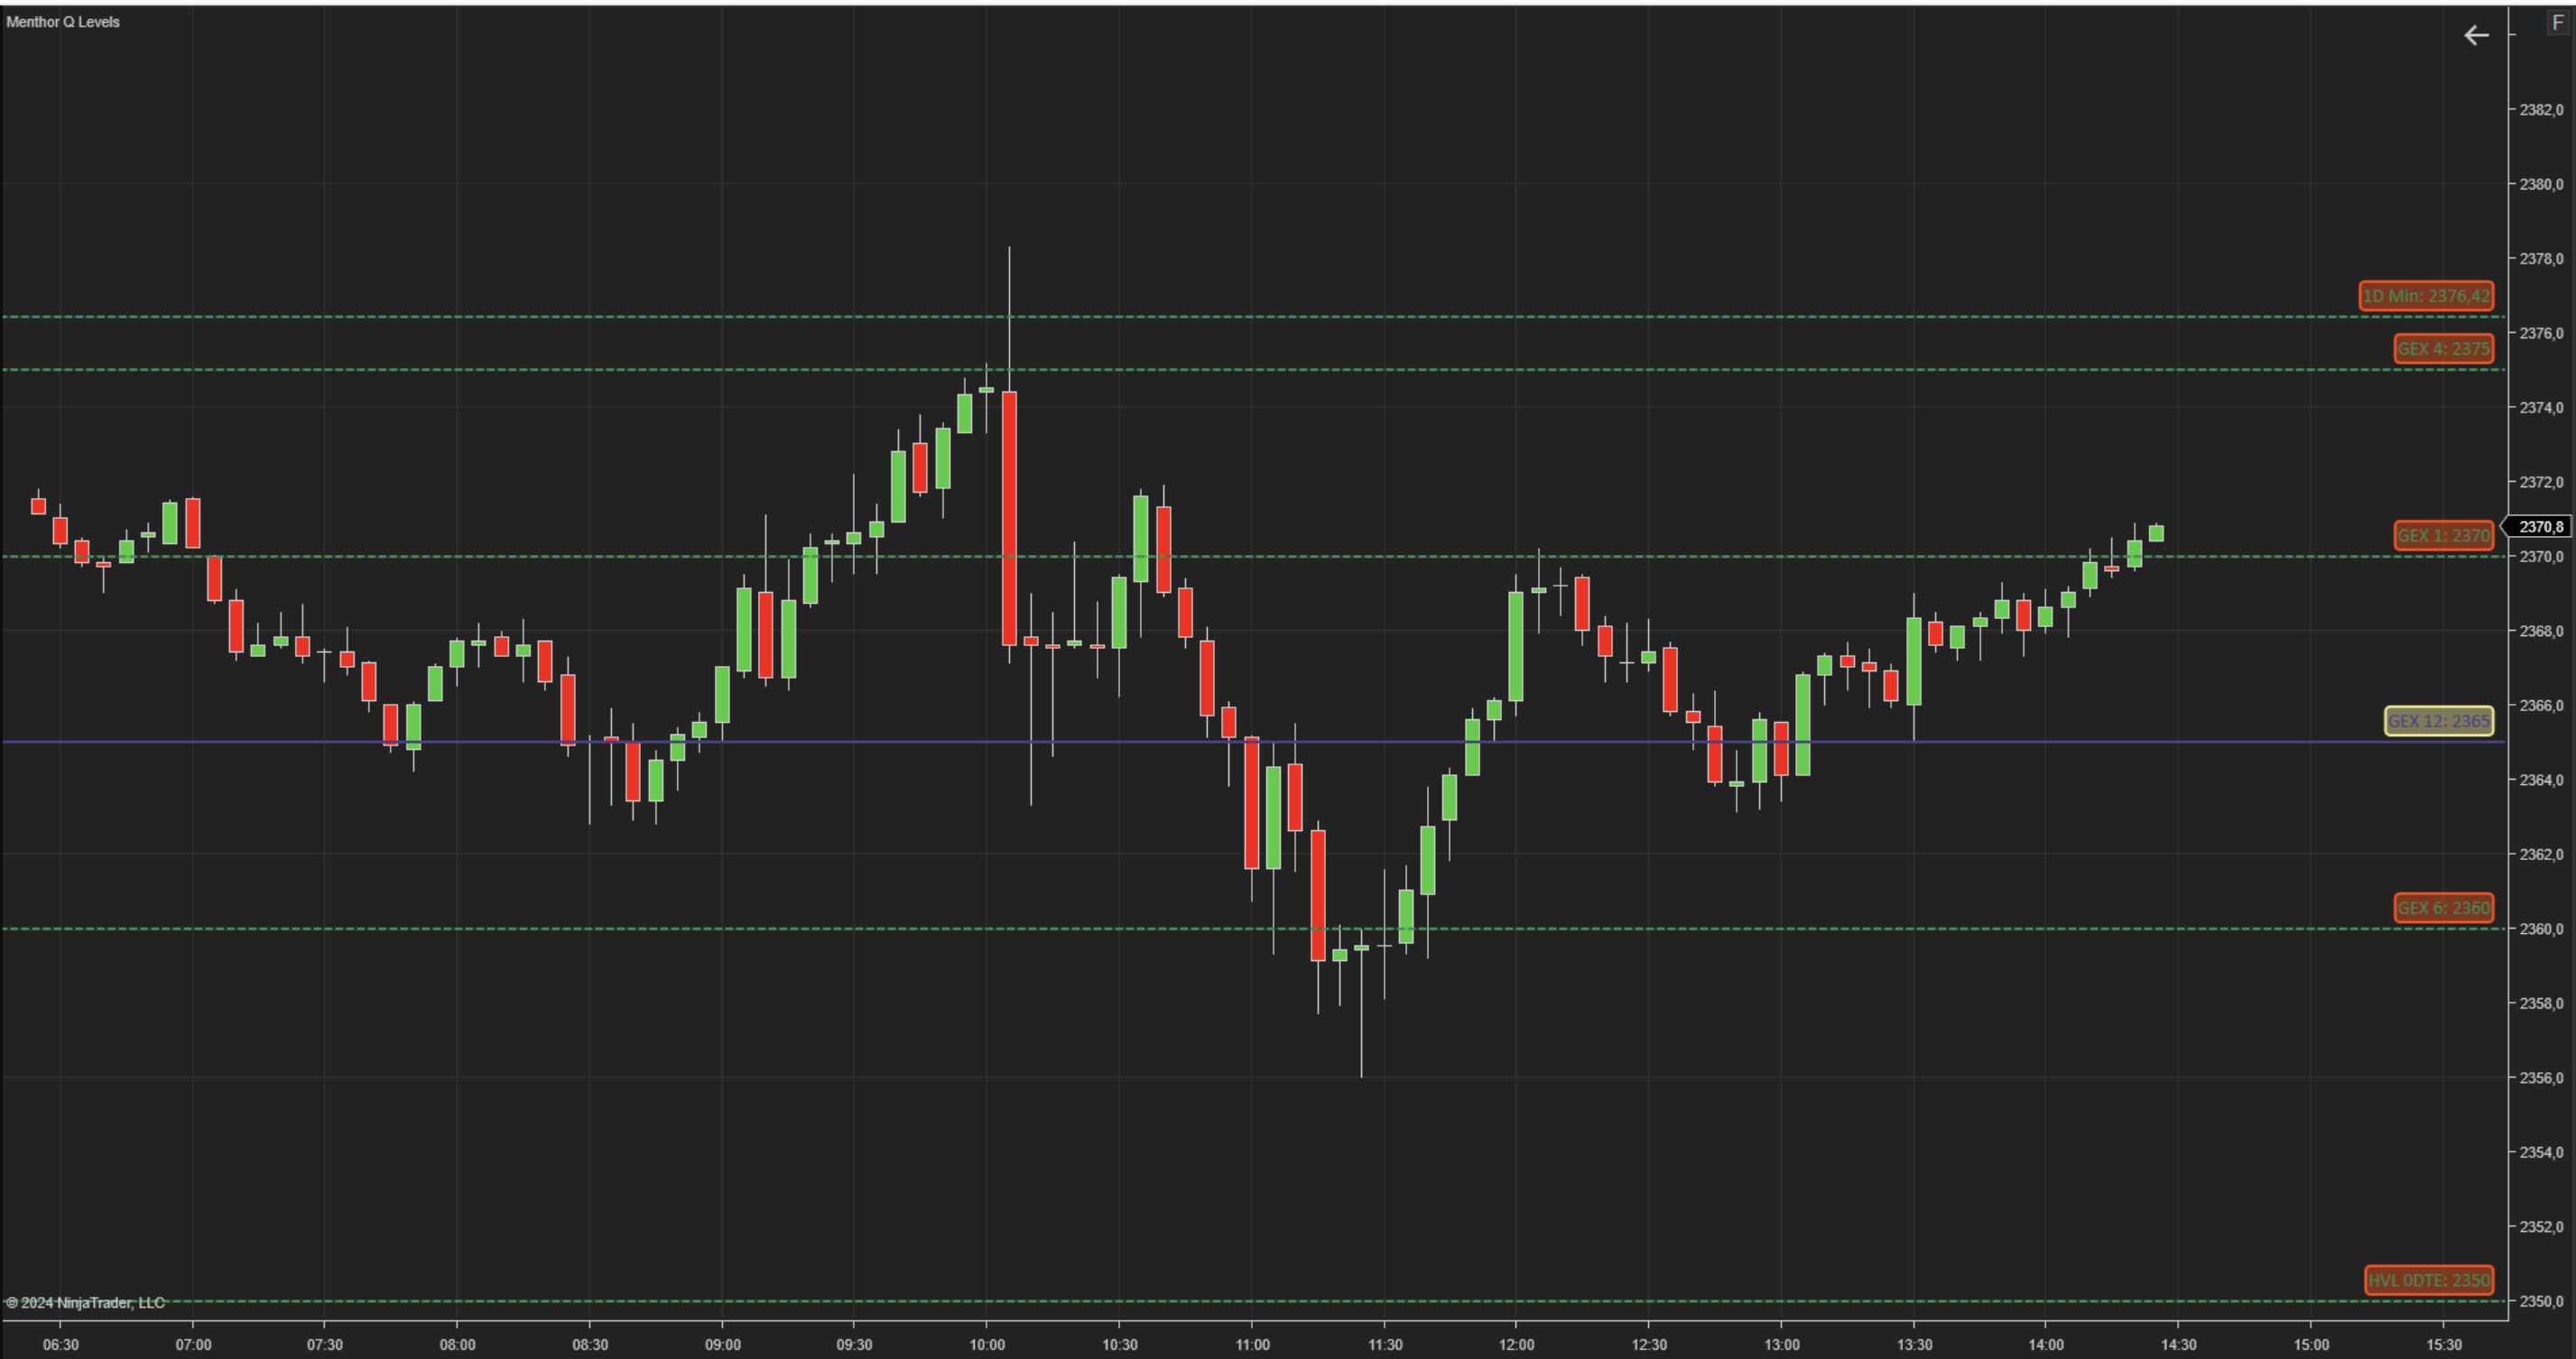
The Menthor Q-Levels indicator for NinjaTrader revolutionizes trading by deriving key levels and market reaction zones directly from options data. Seamlessly integrated into your chart, this innovative tool provides traders with precise and actionable levels that enhance decision-making.
December 2, 2024
Mastering Sideways Markets With Auction Bars and Range Projections
November 19, 2024
Enhancing Your Automated Trading System: Key Insights from Best Pro Trade
November 14, 2024
NinjaTrader New Ecosystem Tools: October 2024 Edition
Enter Email for Updates