AMNTrader is a fully automated trading system. Trading is based on classical technical analysis with filtering such as volume, set of indicators and patterns. It is suitable for all futures and Forex trading instruments.
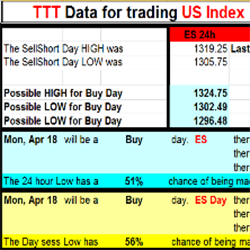
Based on the trading techniques of George Taylor, the TTT E-Book provides the necessary data to trade using the Taylor Trading Technique. After the market close receive 24 hour and daily data to plan your trades for the next trading session. Free 1-week trial available!
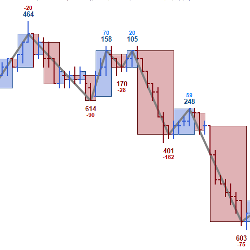
PriceIsKing.com's Futures RAM Indicator is based on a powerful moving average pattern recognition algorithm developed with years of research and testing. Get started with a free 2-week trial today!
If you seek a trend-following system capable of minimizing failed entry signals in choppy markets, your search ends with RK-System Platinum v4. This system provides up to 4 signal types, with the price action signal type proving to be particularly reliable and productive in our backtesting.
Unlock the secrets to market mastery with this 100% free indicator combo. Designed to sharpen your trading and boost your consistency – all with zero cost. Benefit from this comprehensive training and achieve reliable results swiftly. No repaints, just unwavering accuracy!
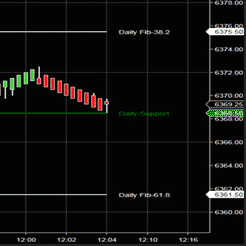
Trading123 Automatic Fibonacci Pivots draws the Fibonacci levels for you. No more second guessing as to where the price action is going. The Fibonacci levels move with the price action from one level to the next. Precise trading using price action for entries and exits at Fibonacci levels.
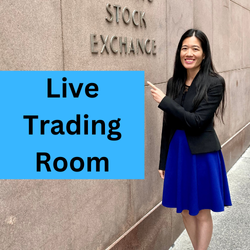
Live trading room for ES S&P 500 day traders. Based on Rose’s Fibonacci trading system, charts are posted and price action shared. Previous trades are reviewed so that students can improve. Discord chat room goals: help students become independent traders & provide a supportive community.
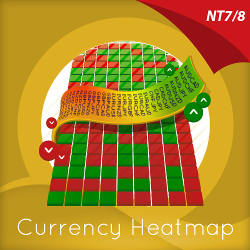
The Currency Heatmap displays the “hottest” and “coldest” areas of the forex landscape. Vertically, 28 currency pairs are listed and ranked from the most bullish to the most bearish. Horizontally, each cell then displays bullish and bearish sentiment across multiple timeframes instantly.
RTMC MNTrader is a fully automated trading system. Trading is based on Renko strategy using an exponential moving average. Filtering system based on the MACD and TMA Slope indicators. It has an improved position support system with flexible settings that will improve trading consistency.
MBoxWave Apprenticeship & Training combines their signature Wyckoff Trading System with individualized training and mentorship. Traders’ training is tailored to their trading style and needs based heavily on the Richard Wyckoff Method.
December 2, 2024
Mastering Sideways Markets With Auction Bars and Range Projections
November 19, 2024
Enhancing Your Automated Trading System: Key Insights from Best Pro Trade
November 14, 2024
NinjaTrader New Ecosystem Tools: October 2024 Edition
Enter Email for Updates