A precise analytical tool derived from statistical trading metrics such as prices and volume, offering insights to inform trading decisions.
Join the Brooks Price Action Trading Room led by Al Brooks. Get daily live analysis, real-time trade setups, and interactive Q&A sessions. Enhance your trading skills with expert insights and strategies. Learn to read the market with precision.
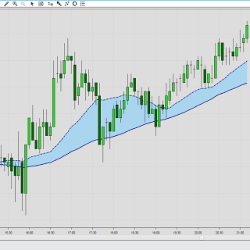
The Multiple MA Cross indicator plots a fast and a slow moving average. For both averages, users may select from over 30 different algorithms. The indicator can be used as a trend filter or for determining support and resistance.
MBoxWave Wyckoff Trading System is an order flow trading system using bid/offer and momentum to identify supply/demand imbalances. The system contains a series of indicators and signals designed to be used together to identify high probability trading opportunities, inspired by Wyckoff methodology.
Your mindset can make or break your trading account. It's your mindset that determines whether you execute your trading plan or break your rules. Go Deep to Level Up Your Trading™ is the most comprehensive trading psychology course on the market. Join now.
Get precious info to start your trading week! Focused 100% in E-mini S&P500 Futures and based in a mix of technical analysis with order flow tools, the newsletter presents possible trading scenarios for the week, highlighting important regions. Sign up now for FREE!
The Spread Trading Tool add on for NinjaTrader 8 allows for charting a variety of spread combinations from 2 leg 1:1 ratio spreads to more advanced butterfly spreads. A control panel connected to the strategy allows for easy entry and management of spread trades.
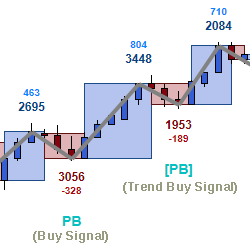
Tacheon Warp is a leading time-based indicator which analyzes markets and projects predictive time-based signals on the right hand side of the chart. Buying and selling pressure signals appear in the future, alerting users to the possibility of moves that have a likelihood of occurring.
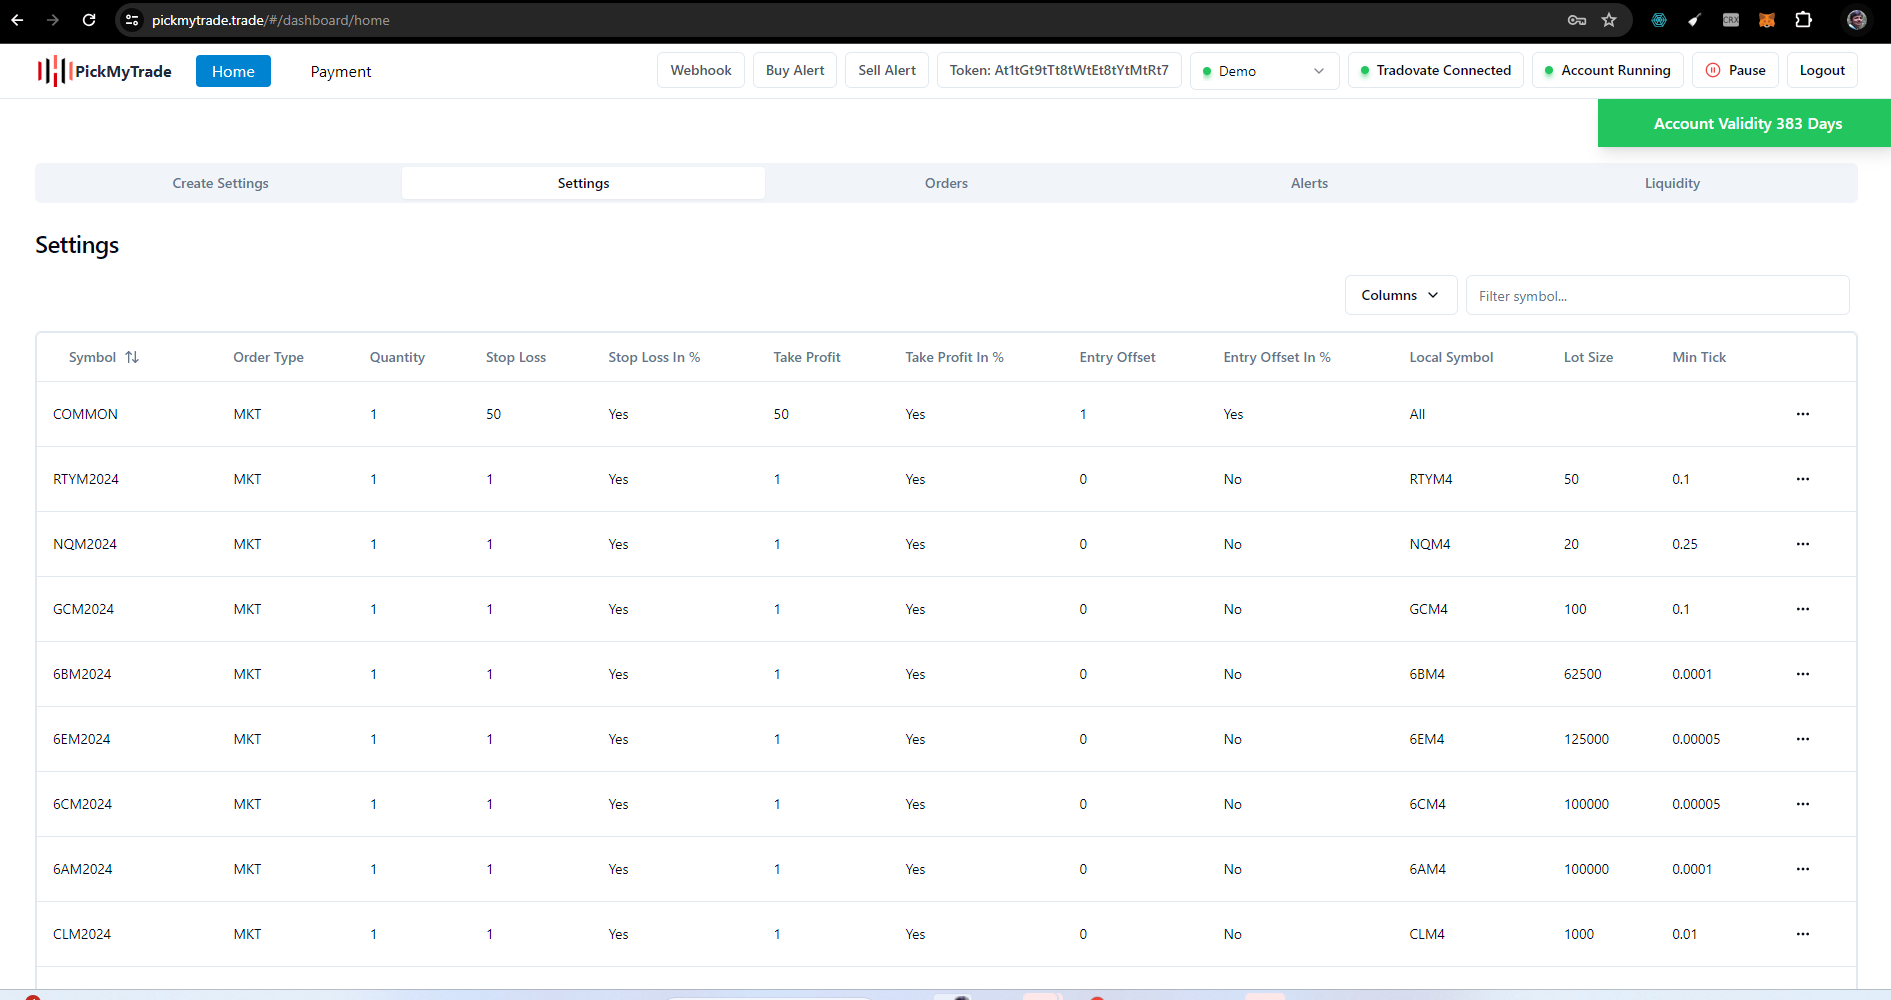
PickMyTrade specializes in automating trading bots, enabling seamless strategy execution for futures across well-known brokers such as Tradovate.
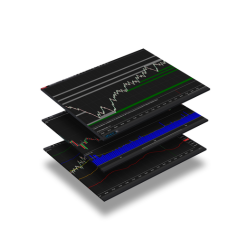
Advanced Indicators are some of the most advanced indicators currently available on the market! Get cutting-edge trading tools - encompassing years of experience in financial market research, engineering, mathematics, a.i., and data science. These unique pro tools not available anywhere else!
December 2, 2024
Mastering Sideways Markets With Auction Bars and Range Projections
November 19, 2024
Enhancing Your Automated Trading System: Key Insights from Best Pro Trade
November 14, 2024
NinjaTrader New Ecosystem Tools: October 2024 Edition
Enter Email for Updates