Have you ever tried to figure out where to place your profit target to hit your profit goal for the day? Or where to place your stop-loss to avoid max drawdown? Calculate and move your orders in a single click with Quick Trade. Includes commissions and realized P&L.
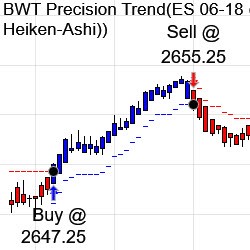
The BWT Precision Indicators originated in 2004. The BWT Precision Trend Indicator provides well placed potential trade signals and never misses a major move on your charts. Other BWT Indicators provide decision support using volume and price action.
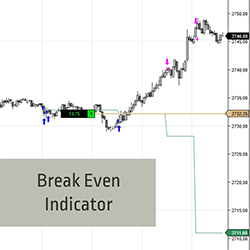
Want to hold on to trades longer? The Break Even indicator calculates profits taken into the average price of the remaining position. See the Break Even line move away from price & gain additional confidence to remain in your trade! It works for both long & short trades. Start your 2-week trial now!
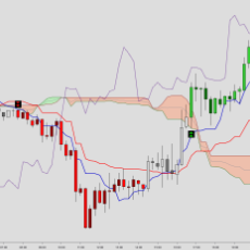
The Ichimoku Kinko Hyo, also known as the Ichimoku Cloud, is a versatile indicator that defines support / resistance, trend direction, momentum and trade signals. One can also think of this indicator displaying momentum in 5 separate time-frames.
This is a NinjaTrader 8 Machine Learning Code for developers. Code is opensource and machine learning is done by the Naïve Bayes algorithm. Learning is based on trendlines, price change, volume and stochastics. Any input/data can be added to the learning process.
The Trapped Trader Oscillator Advanced is IndicatorSmart’s advanced Order Flow indicator that exploits the full capabilities of NT8. With 4 years of development and evolution, it presents order flow in an orderly and easy-to-understand manner with many tradable patterns with established statistics.
Forex Trading Unlocked Online Trading Mentoring provides focused consulting to suit each individual trader’s needs. Forex, futures, stocks, options, and binary options traders can all benefit. Your trading will be placed under a microscope to help eliminate what is holding you back.
Turn your ideas into code! We work 1-on-1 with you to understand your needs and engineer a quality software solution that meets them. Automated strategies, indicators, data analytics, portfolio supervision – let us know your needs, we’re here to make it happen. Get in touch with us today!
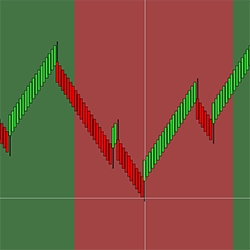
Reversal Bars is an indicator showing you when & where it will plot a reversal bar from as many as five times frames on a single chart.
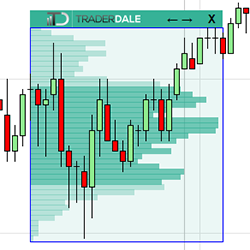
TD’s Flexible Volume Profile helps to reveal institutional trading activity and identifies the strongest support and resistance zones. The use of tick volume data makes it extremely precise leading to potential entries. It is easy to learn, simple to use, and extremely intuitive.
December 2, 2024
Mastering Sideways Markets With Auction Bars and Range Projections
November 19, 2024
Enhancing Your Automated Trading System: Key Insights from Best Pro Trade
November 14, 2024
NinjaTrader New Ecosystem Tools: October 2024 Edition
Enter Email for Updates