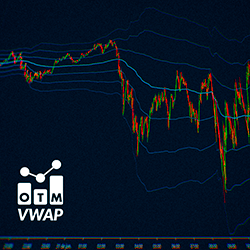
OTM VWAP, the "Volume Weighted Average Price," acts as a moving average based on trading volume. It includes the central VWAP, which serves as support or resistance depending on the price position and its deviations. With this indicator you can set VWAP per session, weekly and monthly.
Signals are produced by an imbalance of prices between sessions, a principle of markets based in physics. You have the potential of 1 trade per day, automated from start to finish and designed to be monitored in some capacity. Users have full control of strategy parameters.
For anyone looking for a more reliable way to get results in the markets: Volume Profile is a professional charting tool that provides real-time market generated information (unlike most technical indicators that are weak & lag). Build your trading business around powerful tools & methods like VP.
TSR Trading Guides contain 10 PDF ebooks compiled with the top articles from Trading Setups Review. Topics include price action, indicators, volume, swing trading, risk management, and trading philosophy. Pay what you want for this fantastic series of trading guides!
QuantCycles harnesses artificial intelligence (AI) and machine learning (ML) for superior predictability, stability and chart analysis. With refined algorithms using advanced Fourier cycle analysis, Hurst cycles and W.D. Gann theories, this latest version delivers exceptionally accurate forecasting.
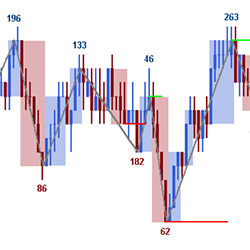
The MAutoFloorCeiling indicator is the culmination of over 2 years of research to determine support / resistance levels automatically. The heart of it utilizes a powerful algorithm based on Wyckoffian concepts of waves, volume, and price levels to gain insight on potential entry points.
This model tracks a universe of approximately 30 equities from industries related to green transportation. This includes suppliers and manufacturers of components, batteries, fuel cells, sensors, autonomous vehicles, power trains, etc. Contact Alpha Vee for more information.
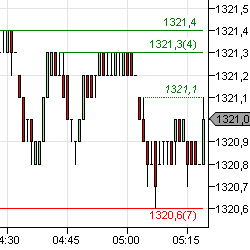
GomBang displays double/multi-top levels on the chart, with the unique ability to merge the levels from multiple charts and time-frames. For instance, if it’s displayed on 5 minute, 4 range and 800 tick charts, the 5 minute chart will display levels from all 3 charts.
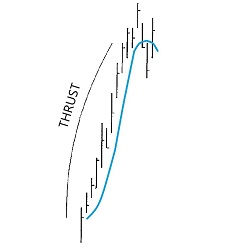
With this tool, traders can now find charts which have potential DiNapoli Directional patterns. Scan multiple markets & time frames in real time for Thrust and other patterns. Use as a chart indicator for easy recognition or as a market analyzer. Video instructions are included - try it today.
Standard NinjaTrader functionality requires at least eight clicks to "Attach to Indicator". With Quick Trade Ninja, you can automatically move your orders based on any indicator you choose - all with a single click. Auto-trailing stop-loss.
December 2, 2024
Mastering Sideways Markets With Auction Bars and Range Projections
November 19, 2024
Enhancing Your Automated Trading System: Key Insights from Best Pro Trade
November 14, 2024
NinjaTrader New Ecosystem Tools: October 2024 Edition
Enter Email for Updates