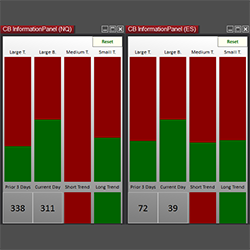
CB Information Panel gives you a snapshot of the buyers and sellers. Keep track of the prior day’s ranges and trend movement.
SniperTrader is a fully automated trading system that can reduce or completely remove the stress of day-to-day trading. It helps advanced or beginner traders with an easy plug-and-play function to set up and operate.
You can now calculate how liquid a symbol is based on its trading activity and filter out risky instruments. A higher no of trades a day would mean that the instrument is drawing attention. Start using this powerful screener tool in your market analyzer today!
This chart analysis package helps you move forward quickly, detecting opportunities and enhancing trading decisions. Trade with greater confidence and consistency. Quick-to-learn, rules-based strategy. Email alerts so you don’t miss an opportunity. Management tools help entering or exiting a trade.
Do you want to know the trading setups we use? Create your own profile FREE on our website and you’ll have access to our course videos where we explain each of our patterns. Gain the knowledge to access our EPyF Trading Room and learn our way of understanding the market.
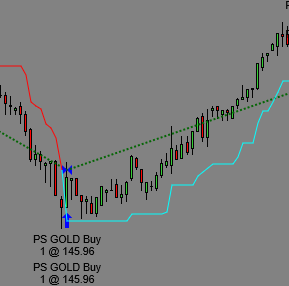
Latency protection is built in to protect you during fast moves. Trend following technologically advanced product with a complex algorithm that adjusts stop distance. SAR type operation. Not to be confused with other SARs that don't change trend until the bar closes. This does it in real time.
NinjaProgramminSchool has been assisting traders for over 5 years in the creation of custom indicators and automated strategies at a reasonable cost. Do you have an idea you want coded or automated? Let us walk you through the process.
BookMap helps traders detect better support and resistance levels by plotting order book data directly on the chart. Through market depth behind price bars, order flow traders can watch the limit order book unfold in real time, highlighting significant price levels such as support and resistance.
Forecast oncoming trading patterns! Trade Forecaster tells you what price action to expect, allowing you to properly prepare your strategy in advance. It will alert you to oncoming scalp, swing or trend trading conditions. See a video of Trade Forecaster in action!
This ES S&P Day trading course uses Fibonacci technical analysis to identify entry and exit strategies. Rose has backtested for many years to determine the optimal Fibonacci Retracement and Extension levels for a consistent system. Get started with a free consultation with Rose!
December 2, 2024
Mastering Sideways Markets With Auction Bars and Range Projections
November 19, 2024
Enhancing Your Automated Trading System: Key Insights from Best Pro Trade
November 14, 2024
NinjaTrader New Ecosystem Tools: October 2024 Edition
Enter Email for Updates