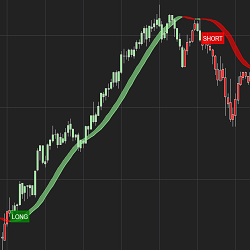
The HolyGrail Algo uses calculations of the Hull Exponential Moving Average to identify market direction. A long or short condition is printed on the chart and the strategy executes the trade by going long or short. You can set defined take profit, stop loss and trail and time of day to trade.
Latency protection is built in to protect you during fast moves. Trend following technologically advanced product with a complex algorithm that adjusts stop distance. SAR type operation. Not to be confused with other SARs that don't change trend until the bar closes. This does it in real time.
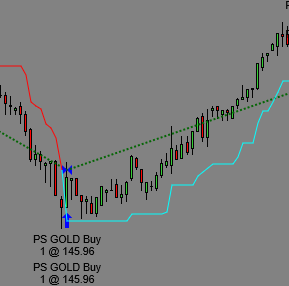
Let’s Run is a breakout strategy used for discretionary or automated trading with a Chart Trader switch. It triggers based on built-in trend finding indicators with customizable settings for stop options and reset buttons. It is fully flexible with both swing and scalp capabilities. Learn more!
Use Statistics to determine intraday High Probability Targets and place stops outside of the regular market noise. This includes Stats on Initial Balance, Mid, Session & Extension ranges, as well as 1-minute rotations & many more! Available for ES, NQ, FDAX & FESX. Download your free report now!
We offer programming services for users of NinjaTrader. Our expert IT professionals will be glad to work on your most ambitious projects. We specialize in programming strategies based on Order Flow, Market Profile and VWAP to automate trading as a mechanical system.
Dynamically see real-time market orders of buyers and sellers in the normal candlestick chart. Get a better feel for the market and its dynamics at the important price zones. Get started today with a two-week free trial!
Free trading psychology masterclass. Learn the complete trading psychology system to overcome destructive trading habits and reach pro-level consistency in as little as 8 weeks (even if you are starting with zero willpower and breaking your rules every time you trade). Register today!
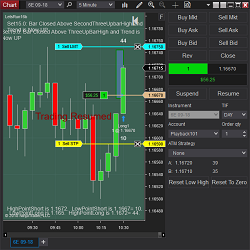
The Breakout Blitz is a full user and discretion controlled tool for traders, built by traders. Available on Ninjatrader 8, this tool can help eliminate your range trading, sitting and waiting dilemma. Once you identify a range, place your breakout box over, choose your direction and go!
One-stop software for beginner & advanced traders. Proprietary intra-day structure & logic. Advanced time & price signals, custom built for ES, NQ & RTY. The markets opened 100 years ago with the same day timespan as today. See a NinjaTrader webinar free at DMIC2059.com. Use code NTW for a discount.
Trade your own capital with consistency. Follow your own plan from day one. Develop and demonstrate your trading skills. Pass qualification to get a Master Account. Show results and get your first $10k withdrawal commission-free. Invest in yourself. It's time to catch a wave!
December 2, 2024
Mastering Sideways Markets With Auction Bars and Range Projections
November 19, 2024
Enhancing Your Automated Trading System: Key Insights from Best Pro Trade
November 14, 2024
NinjaTrader New Ecosystem Tools: October 2024 Edition
Enter Email for Updates