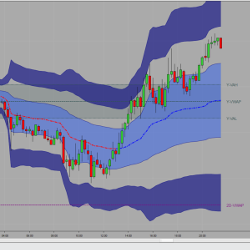
The HolyGrail Algo uses calculations of the Hull Exponential Moving Average to identify market direction. A long or short condition is printed on the chart showing the potential direction an instrument may move. HolyGrail mainly uses it for indices, but it works with any market and any timeframe.
The Volume Weighted Average Price (VWAP) tells traders the average price for all transactions executed during a trading session, such as the current day, week, month or quarter. Many institutional traders execute based on the VWAP, so it is an important price benchmark to control transaction costs.
This course is designed to get you up and running with strategy design and coding for NinjaTrader 8. It provides the most efficient framework that you can adapt for the architecture of most systems and demonstrates various ways to enter and exit the market using the most standard techniques.
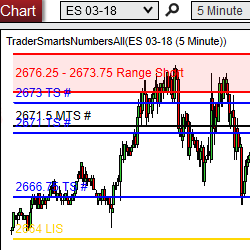
TS TradePlan is a precise support and resistance based trading plan, available for ES, YM, NQ, 6E, CL, and GC futures markets. Trade Plans are produced daily. Get started with a 2-week trial today.
DiNapoli Levels are a combination of leading and lagging indicators providing predefined entry levels, reasonably tight stops, and precalculated profit targets. This package includes the Auto Fibonacci Retracement tool, proprietary Oscillator Predictor and all new MACD Predictor with video demos.
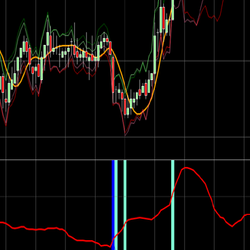
This indicator is extremely versatile and can be used in several time frame charts and even bar charts including range, tick or volume. It works best for instruments like NQ, ES or YM over tick charts. See the real price movement and identify the spikes in the curve plot.
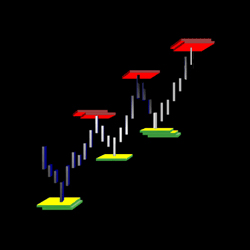
Chompsky Bands: Single and second entry reversal signals and momentum signals, including MACD V5 signals. Includes min/max Bars Per Minute (BPM) filter, Trend Resilience, EMA Tick Separation Filter, Wave Counter. Signal outputs and customizable tags.
Kwikpop 6 brings the trend of any market into clear view utilizing a combination of 26 proprietary indicators to find potential entries and exits. The Dynamic Power Tools are designed to remove the noise from charts and clearly show the trend.
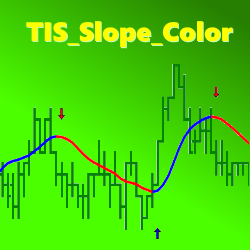
The TIS_Slope_Color indicator allows traders to detect the slope change of any line from any indicator. It can then paint the line, the background, or paint entry signals on a chart.
See trend reversals before they happen with intelligent divergence signals! Predict the trend ahead of the crowd with precise entry and exit points. This innovative indicator uses momentum calculations to warn of trend reversals before they happen!
December 2, 2024
Mastering Sideways Markets With Auction Bars and Range Projections
November 19, 2024
Enhancing Your Automated Trading System: Key Insights from Best Pro Trade
November 14, 2024
NinjaTrader New Ecosystem Tools: October 2024 Edition
Enter Email for Updates