Get information about the development of a dynamic and descretionary trading model. This is intended to inform people of a coaching program tailored to their specific needs in order to make them more consistent traders.
This free package includes Symbol Watermark, which shows the name of the symbol and time frame directly on the chart; Trader Limit, which limits trading when the daily loss level is reached; SR Dynamic Lines (dynamic resistance zones); and many other useful tools. These products are free for life.
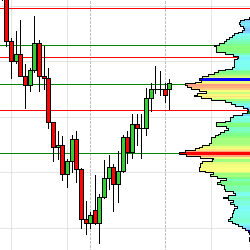
GomMPPro is a high-performance tick-based volume profiler. It offers many data points such as: HVN/LVN, POC, VWAP & VA. Additionally, it features customizable hotkeys allowing traders to quickly toggle between favorite settings. Free 2-week trial available.
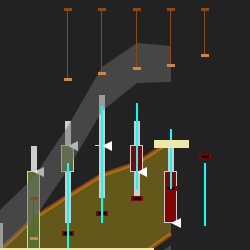
Drummond Geometry unlocks the power of your NinjaTrader platform by revealing the market's hidden structure to you. Drummond Geometry combines short-term moving averages and accurate support/resistance lines, all coordinated on multiple time periods. Trade with confidence!
Learn a battle-tested strategy for trading the markets in under 60 mins per day. Here’s just a fraction of what you’ll learn: How professional traders find good trades, how to read the markets and a market that has unique advantages over others.
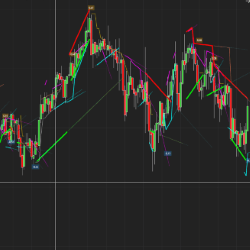
Trendlines can be drawn in so many incorrect ways. Drawing it incorrectly can make most trades losers and vice versa. Getting it right makes all the difference! QTL has a faster and far more accurate approach. Ready to automatically find the most accurate trendlines?
Fully-automated. The VMX selects a time of day to trade during the cash session for stock index futures. This system takes advantage of the volatility created by big institutions moving asset allocations in the equity markets. All positions closed before the end of the cash session.
Do you spend hours reviewing charts and performing repetitive analysis and/or trade management? Why not define your trade setups and let me code them so that you get an alert each time a setup presents itself? Even have them built into an automated strategy.
These consulting services are tailored to meet the unique needs of trading companies, offering expert advice and innovative strategies to enhance performance and profitability. They provide in-depth market analysis, risk management solutions, and trading strategies designed to maximize your success.
Everything you need to know about consistent trading video tutorial course. This course covers the following: How to use the Metatrader4 trading app, market Analysis (Fundamentals & Technicals), risk management, trading psychology (trading plan, journal, management, goal, etc.)
December 2, 2024
Mastering Sideways Markets With Auction Bars and Range Projections
November 19, 2024
Enhancing Your Automated Trading System: Key Insights from Best Pro Trade
November 14, 2024
NinjaTrader New Ecosystem Tools: October 2024 Edition
Enter Email for Updates