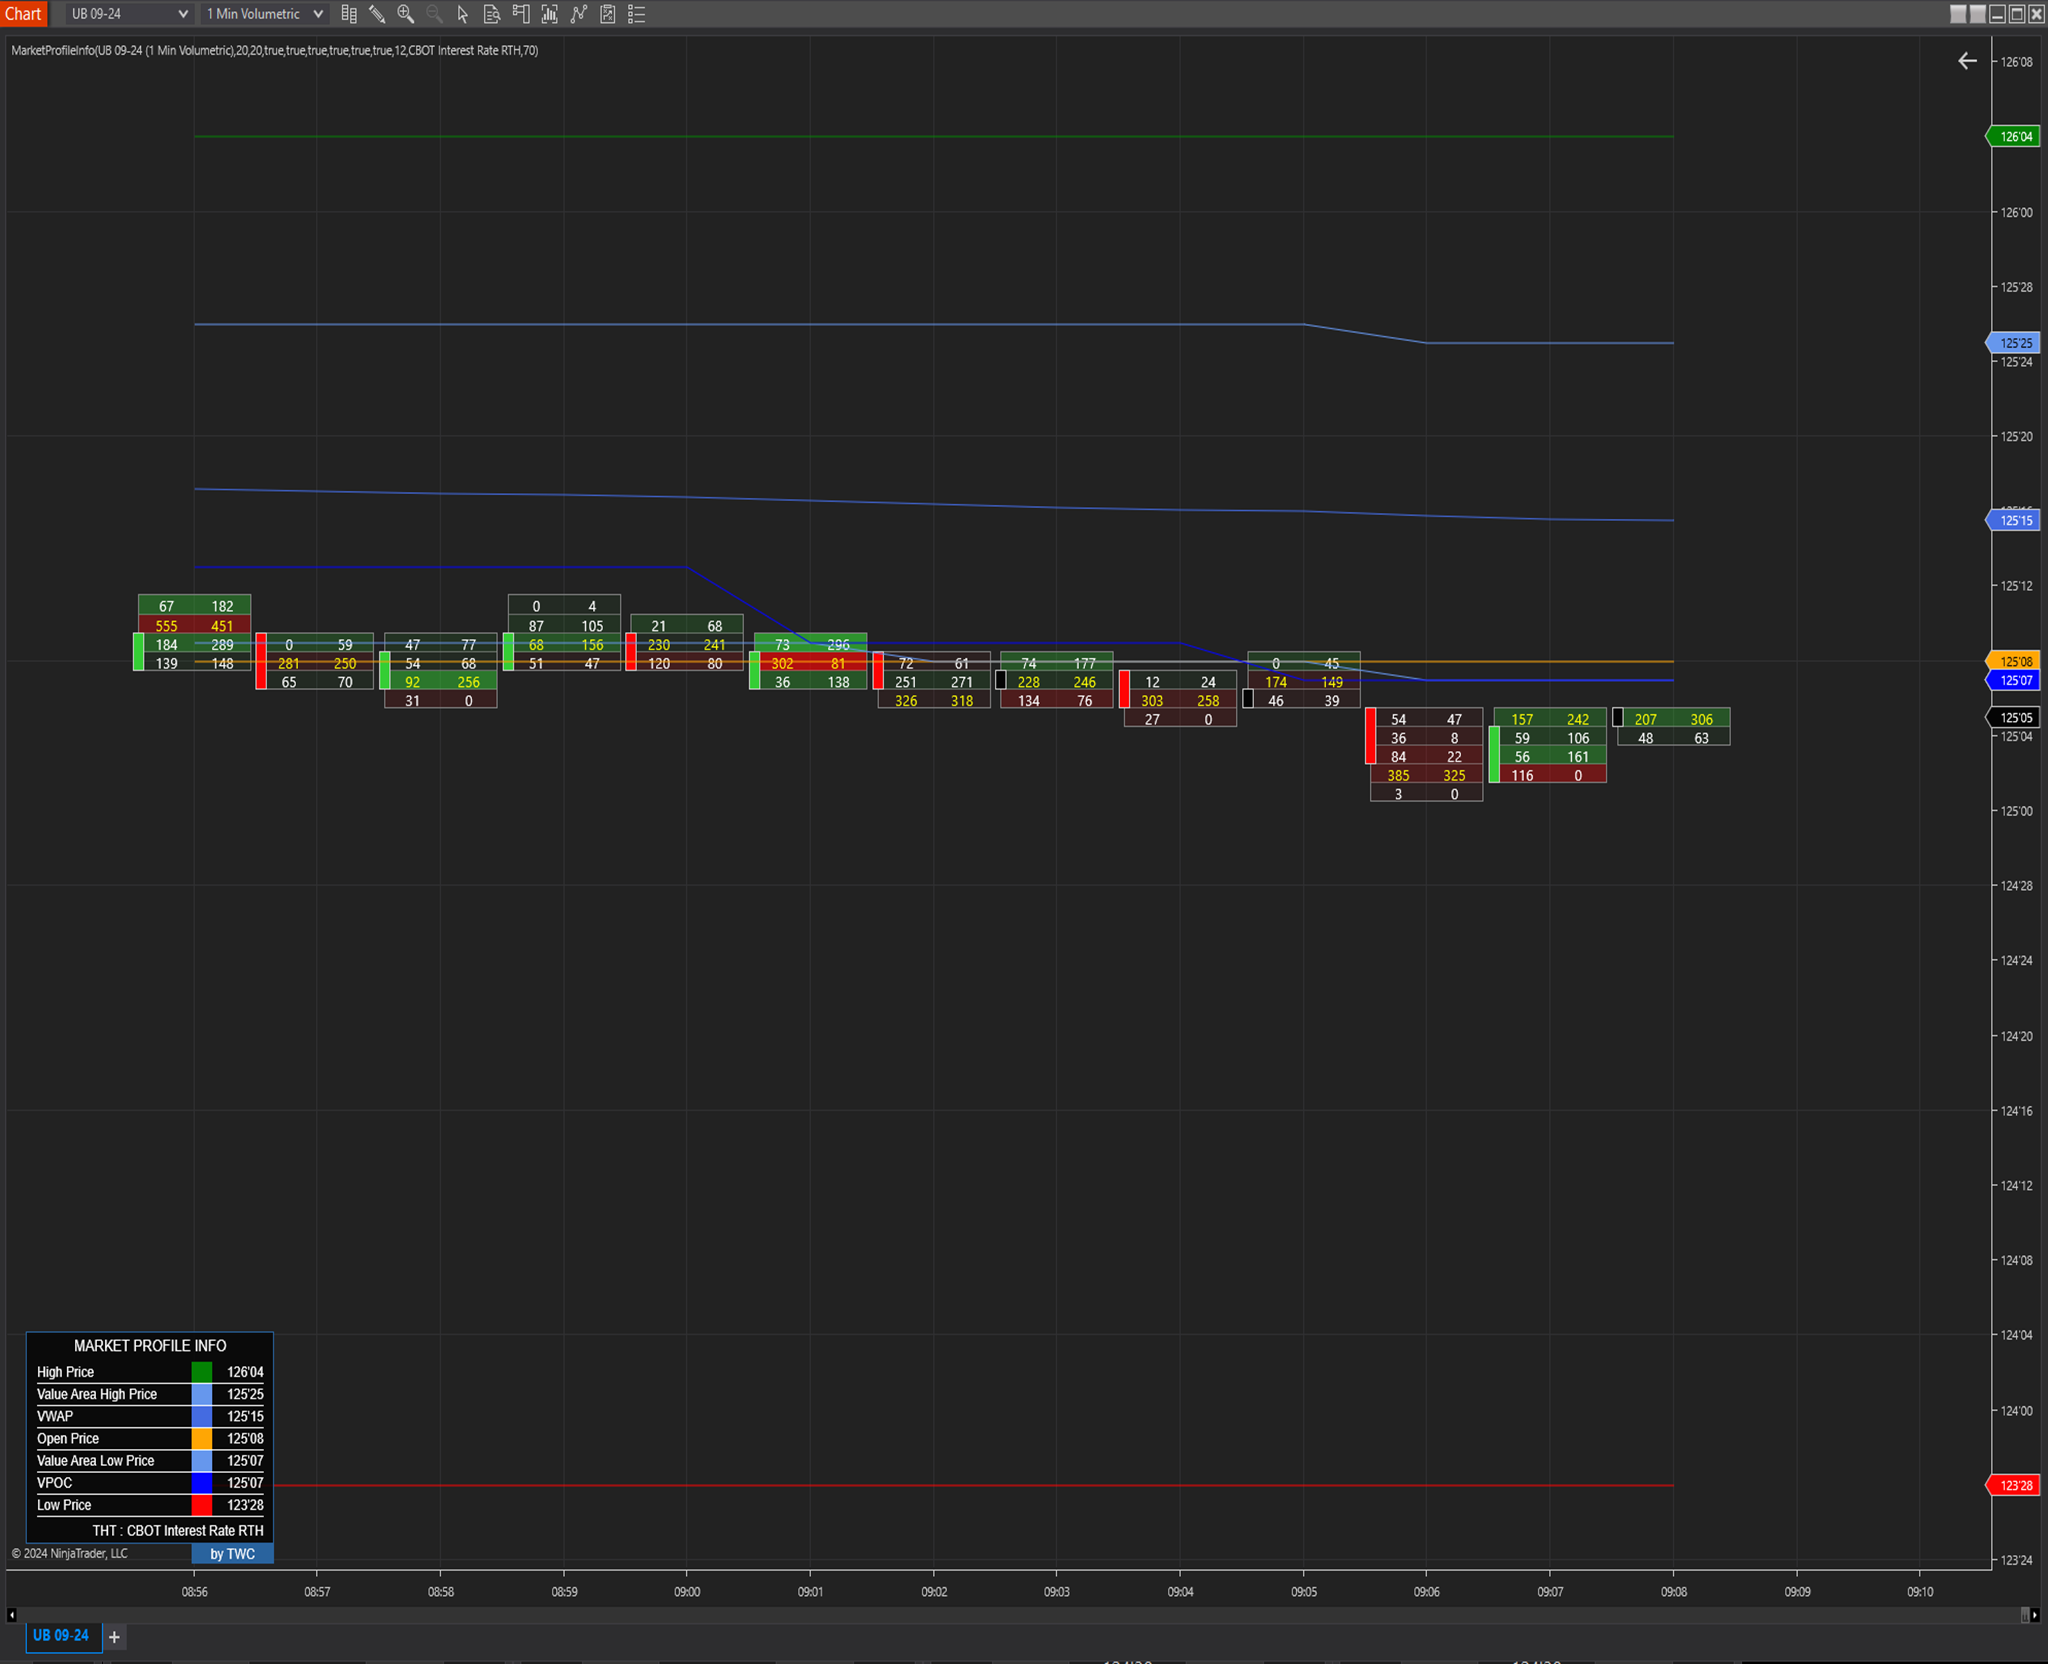
TWC Market Profile Info provides key points on the market profile that are constantly updated in real-time, including the high price of the day, value area high, volume Point of Control (POC), Volume Weighted Average Price (VWAP), value area low, and the low price of the day.
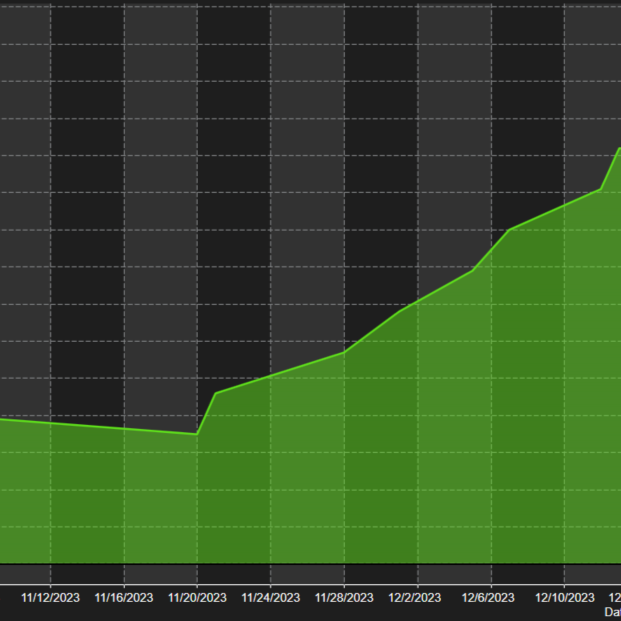
This automated trading strategy is designed for the Russell 2000 futures market. The strategy is easy to use, making it suitable for both experienced traders and beginners. Find out more on www.russell2000strategy.com.
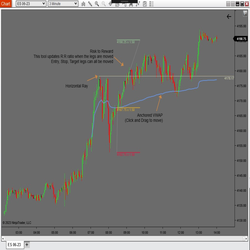
PureAlgo has developed a set of drawing tools to assist you with trading, including Anchored VWAP, Risk Reward PA and Horizontal Line. The package includes all of the tools and is priced at $10.
Use our Auto-Swing Pattern Finder to help find potential market patterns! Swing Pattern Trading is a methodology that utilizes the recognition of specific price patterns and the alignment of exact Fibonacci ratios to determine probable reversal points in the financial markets.
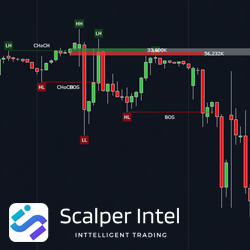
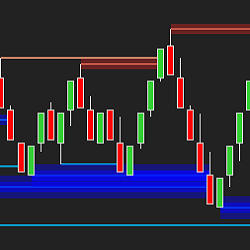
Order Blocks (OB) from ScalperIntel is an indicator that identifies possible supply and demand zones used by Smart Money. The indicator uses two swing structures to determine potential OB and market structure in real time. Finally, it plots the bull/bear volume from these zones.
The Linear Regression Channel (LRC) is designed to truly detect when prices are overbought or oversold. Different than other LRC indicators, the width of the Stealth Traders LRC channel is based on a proprietary formula, designed to pinpoint opportune entry and exit signals. Upgrade Your LRC Today!
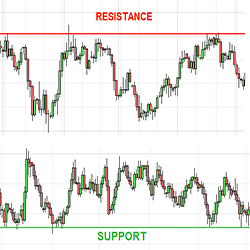
Plots chart and/or synthetic support and resistance lines from a higher time frame.
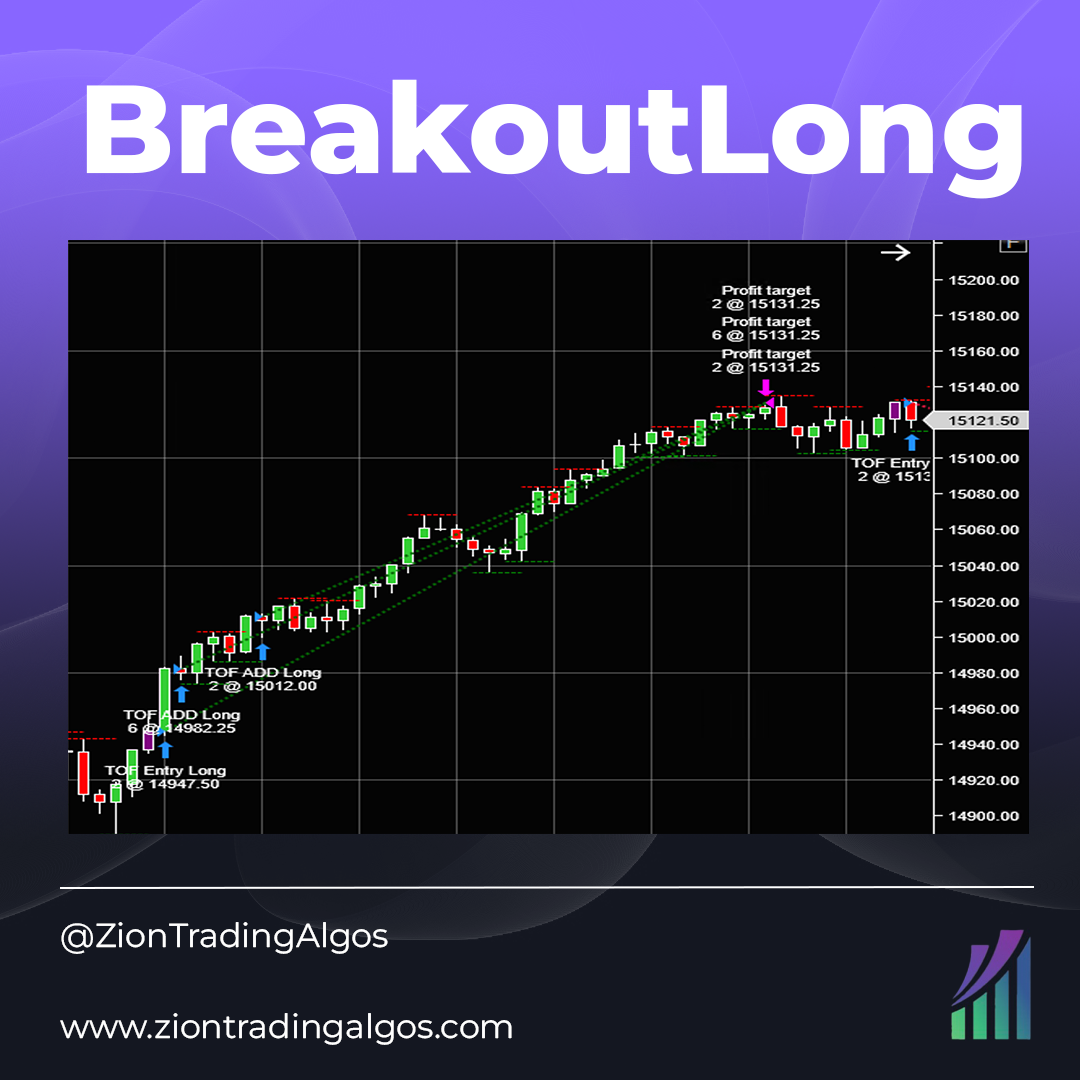
BreakoutLong is an intraday breakout system that trades on the 30-minute chart. It uses an EMA and looks for a specific price pattern-based breakout. It has volatility derived stop loss and take profit targets and only has a single entry and exit system. Tested on MES, MNQ and MYM.
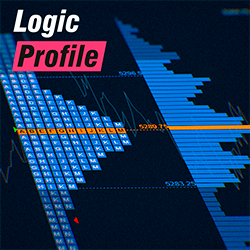
Includes volume profile and TPO market profile, presets for one-click charting, daily, weekly, monthly, date, composite, and drawn profiles. Offers defined or continuous session types and load optimization. All of these features make it one of the most advanced profiles available on the market.
Easily track swing highs and swing lows in multiple timeframes across your chart. Simply define your three swing strengths and Optimal Levels uses heatmap graphics to plot those key levels until they are touched. Strategy Builder compatible!
December 2, 2024
Mastering Sideways Markets With Auction Bars and Range Projections
November 19, 2024
Enhancing Your Automated Trading System: Key Insights from Best Pro Trade
November 14, 2024
NinjaTrader New Ecosystem Tools: October 2024 Edition
Enter Email for Updates